ARKANSAS BEST NDQ-ABFS
TIMELINESS
SAFETY
TECHNICAL
2
3
1
High:
Low:
Raised 5/17/13
32.2
17.8
RECENT
PRICE
34.7
22.0
46.7
25.2
45.7
30.3
NMF RELATIVE
DIV’D
Median: NMF) P/E RATIO 2.38 YLD 0.5%
23.34 P/ERATIO 40.9(Trailing:
50.7
35.7
45.0
21.5
45.1
17.9
34.6
15.8
33.5
18.8
28.5
14.2
22.8
6.4
24.0
9.5
Target Price Range
2016 2017 2018
LEGENDS
6.0 x ″Cash Flow″ p sh
. . . . Relative Price Strength
Options: Yes
Shaded areas indicate recessions
Raised 3/16/01
Raised 8/23/13
BETA 1.20 (1.00 = Market)
VALUE
LINE
64
48
40
32
24
20
16
12
2016-18 PROJECTIONS
Ann’l Total
Price
Gain
Return
High
40 (+70%) 16%
Low
25
(+5%)
3%
Insider Decisions
to Buy
Options
to Sell
O
0
0
0
N
0
0
0
D
0
0
0
J
0
0
0
F
0
0
0
M
0
0
0
A
0
0
0
M
0
0
0
J
0
0
0
8
6
% TOT. RETURN 7/13
Institutional Decisions
3Q2012
58
to Buy
to Sell
73
Hld’s(000) 20140
4Q2012
58
59
20083
1Q2013
54
55
20047
Percent
shares
traded
75
50
25
1 yr.
3 yr.
5 yr.
1997 1998 1999 2000 2001 2002 2003 2004 2005 2006 2007 2008 2009 2010 2011 2012 2013 2014
83.88
3.56
.84
-.59
3.64
19.60
9.8
.56
--
84.21
3.54
1.10
-3.10
4.90
19.61
7.8
.41
--
87.16
4.89
2.14
-2.54
7.25
19.75
4.8
.27
--
91.25
6.23
3.05
-4.64
10.64
20.16
4.5
.29
--
62.34
3.63
1.48
-3.05
13.80
24.48
15.0
.77
--
57.09
3.44
1.43
-2.23
14.27
24.91
18.3
1.00
--
61.01
3.81
1.71
.32
2.72
16.01
25.04
16.2
.92
1.2%
67.89
5.16
2.94
.48
3.15
18.53
25.27
11.4
.60
1.4%
73.30
6.18
3.69
.54
3.67
21.83
25.38
10.0
.53
1.5%
74.85
6.04
3.40
.60
5.93
23.31
24.85
12.5
.67
1.4%
73.86
5.42
2.29
.60
3.89
25.43
24.87
15.2
.81
1.7%
73.25
4.24
1.15
.60
2.35
24.97
25.02
27.7
1.67
1.9%
58.75
.56
d2.46
.60
1.92
19.98
25.07
--2.3%
65.64
1.54
d1.30
.12
.45
18.99
25.26
--.5%
75.04
3.14
.23
.12
2.09
18.32
25.42
NMF
NMF
.5%
80.65
2.96
d.39
.12
1.46
17.92
25.62
--.9%
86.55
3.25
.20
.12
1.15
17.70
26.00
90.75
4.05
1.00
.16
2.25
18.85
26.00
Bold figures are
Value Line
estimates
THIS
STOCK
VL ARITH.*
INDEX
60.4
-1.6
-30.3
36.4
63.6
92.7
© VALUE LINE PUB. LLC
16-18
Revenues per sh
‘‘Cash Flow’’ per sh
Earnings per sh A
Div’ds Decl’d per sh B
Cap’l Spending per sh
Book Value per sh C
Common Shs Outst’g D
Avg Ann’l P/E Ratio
Relative P/E Ratio
Avg Ann’l Div’d Yield
107.70
5.75
2.50
.36
2.70
23.45
26.00
13.0
.85
1.1%
Revenues ($mill)
Operating Margin
Depreciation ($mill)
Net Profit ($mill)
Income Tax Rate
Net Profit Margin
Working Cap’l ($mill)
Long-Term Debt ($mill)
Shr. Equity ($mill)
Return on Total Cap’l
Return on Shr. Equity
Retained to Com Eq
All Div’ds to Net Prof
2800
6.5%
85.0
65.0
35.0%
2.3%
130
30.0
610
10.5%
10.5%
9.0%
14%
1527.5 1715.8 1860.3 1860.5 1836.9 1833.1 1472.9 1657.9
8.2% 10.4% 11.6% 10.7%
8.9%
6.8%
NMF
1.0%
51.9
54.8
61.9
63.5
77.3
76.9
75.2
71.6
43.6
75.5
94.9
86.7
57.5
29.2 d61.1 d32.7
39.4% 40.0% 39.2% 38.8% 37.4% 41.6%
--2.9%
4.4%
5.1%
4.7%
3.1%
1.6%
NMF
NMF
d16.3
43.1
88.1
92.6 137.6 192.9 148.1 165.8
1.8
1.4
1.4
1.2
1.4
1.5
13.4
42.7
400.7 468.4 554.1 579.4 632.4 624.7 500.9 479.7
11.3% 16.1% 17.1% 15.0%
9.2%
4.8%
NMF
NMF
10.9% 16.1% 17.1% 15.0%
9.1%
4.7%
NMF
NMF
8.9% 13.6% 14.6% 12.3%
6.7%
2.2%
NMF
NMF
18%
16%
14%
18%
26%
53%
NMF
NMF
1907.6 2066.0
4.4%
3.5%
73.7
85.5
6.2
d9.8
33.3%
NMF
.3%
NMF
181.4
86.4
46.8 112.9
465.6 459.0
1.6%
NMF
1.3%
NMF
.6%
NMF
52%
NMF
BUSINESS: Arkansas Best Corp. is a freight transportation services and solutions provider. Through its subsidiaries, it offers a wide
variety of logistics solutions including: domestic and global transportation of less-than-truckload (LTL) and full load shipments, expedited ground and time-definite delivery, freight forwarding, freight
brokerage, oversight of roadside assistance and equipment serv-
ices for commercial vehicles, and household goods moving for consumers, corporations, and the military. Employs 9,900. Chairman.
Robert A. Young III owns 4.6% of stock; other officers/directors,
.9%; Five fin’l insts., 30.6% (4/13 Proxy). Pres. & CEO: Judy
McReynolds. Inc.: DE. Addr.: 3801 Old Greenwood Rd., Fort Smith,
AR 72903. Tel.: 479-785-6000. Internet: www.arkbest.com.
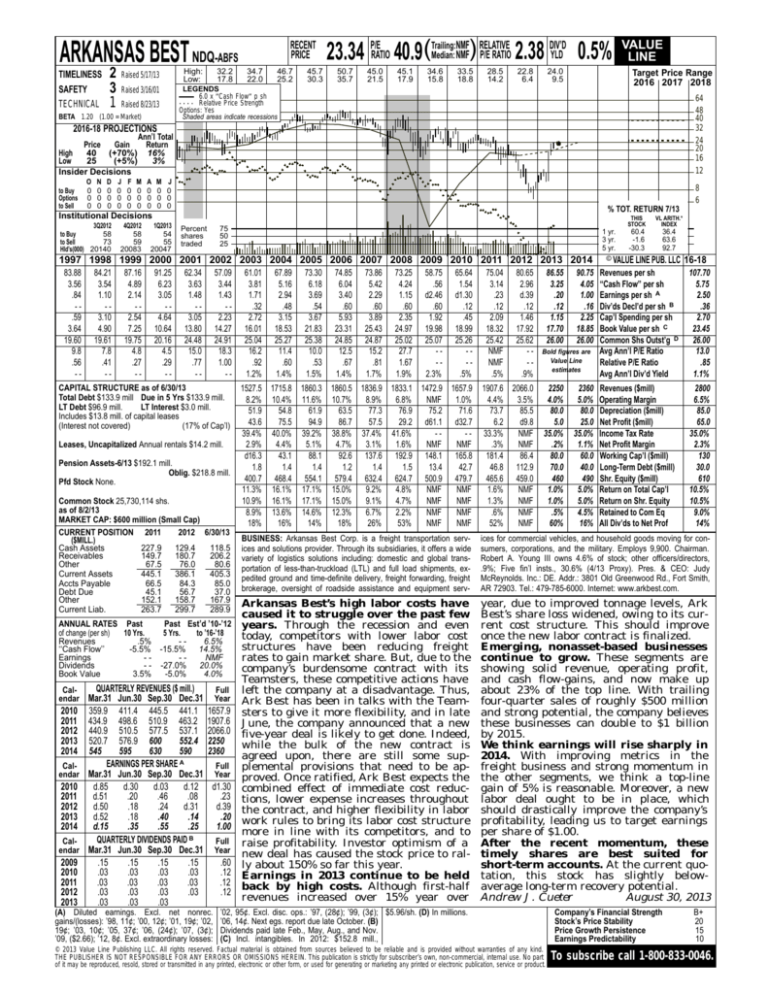
Arkansas Best’s high labor costs have
caused it to struggle over the past few
ANNUAL RATES Past
Past Est’d ’10-’12 years. Through the recession and even
of change (per sh)
10 Yrs.
5 Yrs.
to ’16-’18
today, competitors with lower labor cost
Revenues
.5%
-6.5%
structures have been reducing freight
‘‘Cash Flow’’
-5.5% -15.5% 14.5%
Earnings
--NMF
rates to gain market share. But, due to the
Dividends
- - -27.0% 20.0%
company’s burdensome contract with its
Book Value
3.5%
-5.0%
4.0%
Teamsters, these competitive actions have
QUARTERLY
REVENUES
($
mill.)
CalFull left the company at a disadvantage. Thus,
endar Mar.31 Jun.30 Sep.30 Dec.31 Year Ark Best has been in talks with the Team2010 359.9 411.4 445.5 441.1 1657.9 sters to give it more flexibility, and in late
2011 434.9 498.6 510.9 463.2 1907.6 June, the company announced that a new
2012 440.9 510.5 577.5 537.1 2066.0 five-year deal is likely to get done. Indeed,
2013 520.7 576.9 600
552.4 2250
while the bulk of the new contract is
2014 545
595
630
590
2360
agreed upon, there are still some supA
EARNINGS
PER
SHARE
CalFull plemental provisions that need to be apMar.31
Jun.30
Sep.30
Dec.31
endar
Year proved. Once ratified, Ark Best expects the
2010
d.85
d.30
d.03
d.12 d1.30 combined effect of immediate cost reduc2011
d.51
.20
.46
.08
.23 tions, lower expense increases throughout
2012
d.50
.18
.24
d.31
d.39 the contract, and higher flexibility in labor
2013
d.52
.18
.40
.14
.20 work rules to bring its labor cost structure
2014
d.15
.35
.55
.25
1.00
more in line with its competitors, and to
QUARTERLY DIVIDENDS PAID B
CalFull raise profitability. Investor optimism of a
endar Mar.31 Jun.30 Sep.30 Dec.31 Year new deal has caused the stock price to ral2009
.15
.15
.15
.15
.60 ly about 150% so far this year.
2010
.03
.03
.03
.03
.12 Earnings in 2013 continue to be held
2011
.03
.03
.03
.03
.12 back by high costs. Although first-half
2012
.03
.03
.03
.03
.12
revenues increased over 15% year over
2013
.03
.03
.03
year, due to improved tonnage levels, Ark
Best’s share loss widened, owing to its current cost structure. This should improve
once the new labor contract is finalized.
Emerging, nonasset-based businesses
continue to grow. These segments are
showing solid revenue, operating profit,
and cash flow-gains, and now make up
about 23% of the top line. With trailing
four-quarter sales of roughly $500 million
and strong potential, the company believes
these businesses can double to $1 billion
by 2015.
We think earnings will rise sharply in
2014. With improving metrics in the
freight business and strong momentum in
the other segments, we think a top-line
gain of 5% is reasonable. Moreover, a new
labor deal ought to be in place, which
should drastically improve the company’s
profitability, leading us to target earnings
per share of $1.00.
After the recent momentum, these
timely shares are best suited for
short-term accounts. At the current quotation, this stock has slightly belowaverage long-term recovery potential.
Andrew J. Cueter
August 30, 2013
CAPITAL STRUCTURE as of 6/30/13
Total Debt $133.9 mill Due in 5 Yrs $133.9 mill.
LT Debt $96.9 mill.
LT Interest $3.0 mill.
Includes $13.8 mill. of capital leases
(Interest not covered)
(17% of Cap’l)
Leases, Uncapitalized Annual rentals $14.2 mill.
Pension Assets-6/13 $192.1 mill.
Oblig. $218.8 mill.
Pfd Stock None.
Common Stock 25,730,114 shs.
as of 8/2/13
MARKET CAP: $600 million (Small Cap)
CURRENT POSITION 2011
2012 6/30/13
($MILL.)
Cash Assets
227.9
129.4
118.5
Receivables
149.7
180.7
206.2
Other
67.5
76.0
80.6
Current Assets
445.1
386.1
405.3
Accts Payable
66.5
84.3
85.0
Debt Due
45.1
56.7
37.0
Other
152.1
158.7
167.9
Current Liab.
263.7
299.7
289.9
(A) Diluted earnings. Excl. net nonrec.
gains/(losses): ’98, 11¢; ’00, 12¢; ’01, 19¢; ’02,
19¢; ’03, 10¢; ’05, 37¢; ’06, (24¢); ’07, (3¢);
’09, ($2.66); ’12, 8¢. Excl. extraordinary losses:
2250
4.0%
80.0
5.0
35.0%
.2%
80.0
70.0
460
1.0%
1.0%
.5%
60%
’02, 95¢. Excl. disc. ops.: ’97, (28¢); ’99, (3¢); $5.96/sh. (D) In millions.
’06, 14¢. Next egs. report due late October. (B)
Dividends paid late Feb., May, Aug., and Nov.
(C) Incl. intangibles. In 2012: $152.8 mill.,
© 2013 Value Line Publishing LLC. All rights reserved. Factual material is obtained from sources believed to be reliable and is provided without warranties of any kind.
THE PUBLISHER IS NOT RESPONSIBLE FOR ANY ERRORS OR OMISSIONS HEREIN. This publication is strictly for subscriber’s own, non-commercial, internal use. No part
of it may be reproduced, resold, stored or transmitted in any printed, electronic or other form, or used for generating or marketing any printed or electronic publication, service or product.
2360
5.0%
80.0
25.0
35.0%
1.1%
60.0
40.0
490
5.0%
5.0%
4.5%
16%
Company’s Financial Strength
Stock’s Price Stability
Price Growth Persistence
Earnings Predictability
B+
20
15
10
To subscribe call 1-800-833-0046.


