CHEVRON CORP. NYSE-CVX
TIMELINESS
SAFETY
TECHNICAL
4
1
3
High:
Low:
Raised 12/11/15
66.0
49.8
RECENT
PRICE
76.2
53.8
95.5
65.0
104.6
55.5
34.7 RELATIVE
DIV’D
Median: 8.5) P/E RATIO NMF YLD 5.0%
84.91 P/ERATIONMF(Trailing:
79.8
56.1
92.4
66.8
110.0
86.7
118.5
95.7
127.8
108.7
135.1
100.1
113.0
69.6
90.1
75.3
Target Price Range
2019 2020 2021
LEGENDS
6.0 x ″Cash Flow″ p sh
. . . . Relative Price Strength
2-for-1 split 9/04
Options: Yes
Shaded area indicates recession
Raised 1/4/91
Raised 3/4/16
BETA 1.15 (1.00 = Market)
2019-21 PROJECTIONS
VALUE
LINE
200
160
100
80
60
50
40
30
Ann’l Total
Price
Gain
Return
High 140 (+65%) 17%
Low 115 (+35%) 12%
Insider Decisions
to Buy
Options
to Sell
A
0
0
0
M
1
0
0
J
0
0
0
J
0
0
0
A
4
1
0
S
0
0
0
O
0
0
0
N
0
2
2
D
0
3
0
20
% TOT. RETURN 1/16
Institutional Decisions
1Q2015
2Q2015
3Q2015
882
879
742
to Buy
to Sell
829
793
934
Hld’s(000)118346111652951165562
Percent
shares
traded
18
12
6
1 yr.
3 yr.
5 yr.
2000 2001 2002 2003 2004 2005A 2006 2007 2008 2009 2010 2011 2012 2013 2014 2015 2016 2017
40.63 50.11 46.37 56.94 73.70 88.77 86.02 105.67 136.21 85.50 102.85 128.06 124.27 119.61
6.26
4.88
2.98
5.90
8.67
8.96 10.09 13.11 16.69 11.26 16.10 20.09 20.34 18.61
3.99
1.55
.54
3.48
6.28
6.54
7.80
8.77 11.67
5.24
9.48 13.44 13.32 11.09
1.30
1.33
1.40
1.43
1.54
1.75
2.01
2.26
2.53
2.66
2.84
3.09
3.51
3.90
2.85
4.58
3.56
2.63
2.99
3.90
5.65
7.98
9.81
9.89
9.84 13.38 15.89 19.85
15.53 16.02 14.79 16.97 21.47 28.07 28.22 36.88 43.23 45.79 52.74 61.67 70.80 78.62
1283.1 2120.2 2136.3 2138.3 2107.1 2232.7 2442.7 2090.4 2004.2 2007.4 1992.5 1981.2 1946.7 1913.3
10.6
28.8
NMF
10.2
7.6
8.8
8.1
9.4
7.3
13.4
8.2
7.5
8.1
10.9
.69
1.48
NMF
.58
.40
.47
.44
.50
.44
.89
.52
.47
.52
.61
3.1%
3.0%
3.5%
4.0%
3.2%
3.0%
3.2%
2.7%
3.0%
3.8%
3.6%
3.1%
3.3%
3.2%
210118
19.1%
7506.0
17138
46.4%
Leases, Uncapitalized Annual rentals $316.2 mill.
8.2%
Pension Assets-12/14 $5.98 bill. Oblig. $7.23 bill. 7895.0
7679.0
Pfd Stock None
68935
Common Stock 1,867,221,390 shs.
22.7%
as of 1/29/16
MARKET CAP: $158 billion (Large Cap)
24.9%
CURRENT POSITION 2013
2014 12/31/15 18.5%
($MILL.)
26%
CAPITAL STRUCTURE as of 12/31/15
Total Debt $38592 mill. Due in 5 Yrs $488 mill.
LT Debt $38104 mill. LT Interest $422.7 mill.
Includes $197 million capitalized leases.
(20% of Cap’l)
Cash Assets
Receivables
Inventory (LIFO)
Other
Current Assets
Accts Payable
Debt Due
Other
Current Liab.
16516
21782
6809
7134
52241
23210
2126
10890
36226
ANNUAL RATES Past
of change (per sh) 10 Yrs.
Sales
7.5%
‘‘Cash Flow’’
12.5%
Earnings
13.0%
Dividends
10.5%
Book Value
16.0%
Calendar
2013
2014
2015
2016
2017
Calendar
2013
2014
2015
2016
2017
Calendar
2012
2013
2014
2015
2016
13215
24234
10144
7098
54691
23965
2087
10867
36919
11332
23489
9763
7056
51640
25108
488
10817
36413
Past Est’d ’12-’14
5 Yrs.
to ’19-’21
1.5%
-2.0%
7.0%
.5%
6.0%
-1.5%
9.5%
2.5%
13.0%
3.0%
QUARTERLY SALES ($ mill.) A
Full
Mar.31 Jun.30 Sep.30 Dec.31 Year
56818 57369 58503 56158 228848
53265 57938 54679 46088 211970
34558 40357 34315 29247 138477
31000 35700 39900 43000 149600
34000 38000 43000 52000 167000
EARNINGS PER SHARE B
Full
Mar.31 Jun.30 Sep.30 Dec.31 Year
3.18
2.77
2.57
2.57 11.09
2.36
2.98
2.95
1.85 10.14
1.37
.30
1.09
d.31
2.45
d.25
.30
.65
.80
1.50
1.00
.90
1.10
1.20
4.20
QUARTERLY DIVIDENDS PAID C■
Full
Mar.31 Jun.30 Sep.30 Dec.31 Year
.81
.90
.90
.90
3.51
.90
1.00
1.00
1.00
3.90
1.00
1.07
1.07
1.07
4.21
1.07
1.07
1.07
1.07
4.28
(A) Sales exclude (consumer) petroleum &
chemicals excise taxes. 2005 sales figures
restated to account for UNOCAL merger.
(B) Based on diluted shares. Incl. nonrecur.
220904
18.5%
8708.0
18688
41.9%
8.5%
5579.0
6070.0
77088
22.6%
24.2%
18.0%
26%
112.74 74.16 80.20 89.55
19.17 13.70 11.85 14.15
10.14
2.45
1.50
4.20
4.21
4.28
4.28
4.28
18.83 18.21 14.25 12.35
83.07 81.79 84.70 88.45
1880.2 1867.2 1865.0 1865.0
11.9
39.3 Bold figures are
Value Line
.63
1.99
estimates
3.5%
4.4%
THIS
STOCK
VL ARITH.*
INDEX
-11.9
-16.1
8.6
-10.4
20.6
40.9
© VALUE LINE PUB. LLC
Sales per sh A
‘‘Cash Flow’’ per sh
Earnings per sh B
Div’ds Decl’d per sh C■
Cap’l Spending per sh
Book Value per sh
Common Shs Outst’g D
Avg Ann’l P/E Ratio
Relative P/E Ratio
Avg Ann’l Div’d Yield
273005 171636 204928 253706 241909 228848 211970 138477 149600 167000 Sales ($mill) A
19.3% 18.2% 22.3% 24.0% 24.9% 22.2% 23.2%
9.5%
6.5% 11.0% Operating Margin
9528.0 12110 13063 12911 13413 14186 16793 21035 19300 18600 Depreciation ($mill)
23931 10483 19024 26895 26179 21423 19241 4587.0
2800
7835 Net Profit ($mill)
44.3% 43.4% 40.7% 43.5% 43.5% 40.3% 38.3%
5.3% 17.0% 33.0% Income Tax Rate
8.8%
6.1%
9.3% 10.6% 10.8%
9.4%
9.1%
3.3%
1.9%
4.7% Net Profit Margin
4447.0 11005 19829 19634 21508 16015 17772 15227 16700 17000 Working Cap’l ($mill)
6083.0 10130 11289 9812.0 12065 20057 24028 38104 35400 32000 Long-Term Debt ($mill)
86648 91914 105081 122181 137832 150427 156191 152716 158000 165000 Shr. Equity ($mill)
26.0% 10.6% 16.6% 20.6% 17.7% 12.8% 11.0%
2.5%
1.5%
4.0% Return on Total Cap’l
27.6% 11.4% 18.1% 22.0% 19.0% 14.2% 12.3%
3.0%
2.0%
4.5% Return on Shr. Equity
21.7%
5.6% 12.7% 17.0% 14.0%
9.3%
7.2%
NMF
NMF
NMF Retained to Com Eq
22%
51%
30%
23%
26%
35%
41%
NMF
NMF
NMF All Div’ds to Net Prof
19-21
103.20
19.75
10.40
4.56
14.20
94.95
1870.0
12.0
.75
3.9%
193000
23.0%
17510
19450
38.0%
10.1%
21050
28300
177600
9.5%
11.0%
6.0%
44%
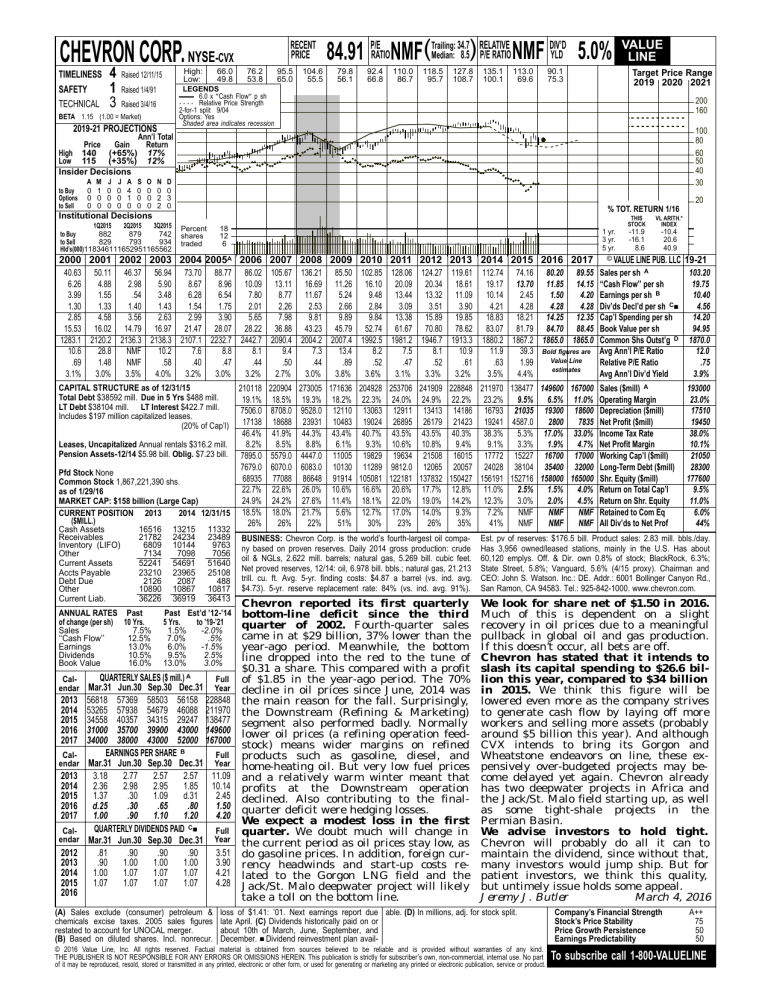
BUSINESS: Chevron Corp. is the world’s fourth-largest oil company based on proven reserves. Daily 2014 gross production: crude
oil & NGLs, 2.622 mill. barrels; natural gas, 5.269 bill. cubic feet.
Net proved reserves, 12/14: oil, 6.978 bill. bbls.; natural gas, 21.213
trill. cu. ft. Avg. 5-yr. finding costs: $4.87 a barrel (vs. ind. avg.
$4.73). 5-yr. reserve replacement rate: 84% (vs. ind. avg. 91%).
Est. pv of reserves: $176.5 bill. Product sales: 2.83 mill. bbls./day.
Has 3,956 owned/leased stations, mainly in the U.S. Has about
60,120 emplys. Off. & Dir. own 0.8% of stock; BlackRock, 6.3%;
State Street, 5.8%; Vanguard, 5.6% (4/15 proxy). Chairman and
CEO: John S. Watson. Inc.: DE. Addr.: 6001 Bollinger Canyon Rd.,
San Ramon, CA 94583. Tel.: 925-842-1000. www.chevron.com.
Chevron reported its first quarterly
bottom-line deficit since the third
quarter of 2002. Fourth-quarter sales
came in at $29 billion, 37% lower than the
year-ago period. Meanwhile, the bottom
line dropped into the red to the tune of
$0.31 a share. This compared with a profit
of $1.85 in the year-ago period. The 70%
decline in oil prices since June, 2014 was
the main reason for the fall. Surprisingly,
the Downstream (Refining & Marketing)
segment also performed badly. Normally
lower oil prices (a refining operation feedstock) means wider margins on refined
products such as gasoline, diesel, and
home-heating oil. But very low fuel prices
and a relatively warm winter meant that
profits at the Downstream operation
declined. Also contributing to the finalquarter deficit were hedging losses.
We expect a modest loss in the first
quarter. We doubt much will change in
the current period as oil prices stay low, as
do gasoline prices. In addition, foreign currency headwinds and start-up costs related to the Gorgon LNG field and the
Jack/St. Malo deepwater project will likely
take a toll on the bottom line.
We look for share net of $1.50 in 2016.
Much of this is dependent on a slight
recovery in oil prices due to a meaningful
pullback in global oil and gas production.
If this doesn’t occur, all bets are off.
Chevron has stated that it intends to
slash its capital spending to $26.6 billion this year, compared to $34 billion
in 2015. We think this figure will be
lowered even more as the company strives
to generate cash flow by laying off more
workers and selling more assets (probably
around $5 billion this year). And although
CVX intends to bring its Gorgon and
Wheatstone endeavors on line, these expensively over-budgeted projects may become delayed yet again. Chevron already
has two deepwater projects in Africa and
the Jack/St. Malo field starting up, as well
as some tight-shale projects in the
Permian Basin.
We advise investors to hold tight.
Chevron will probably do all it can to
maintain the dividend, since without that,
many investors would jump ship. But for
patient investors, we think this quality,
but untimely issue holds some appeal.
Jeremy J. Butler
March 4, 2016
loss of $1.41: ’01. Next earnings report due able. (D) In millions, adj. for stock split.
late April. (C) Dividends historically paid on or
about 10th of March, June, September, and
December. ■ Dividend reinvestment plan avail-
© 2016 Value Line, Inc. All rights reserved. Factual material is obtained from sources believed to be reliable and is provided without warranties of any kind.
THE PUBLISHER IS NOT RESPONSIBLE FOR ANY ERRORS OR OMISSIONS HEREIN. This publication is strictly for subscriber’s own, non-commercial, internal use. No part
of it may be reproduced, resold, stored or transmitted in any printed, electronic or other form, or used for generating or marketing any printed or electronic publication, service or product.
Company’s Financial Strength
Stock’s Price Stability
Price Growth Persistence
Earnings Predictability
A++
75
50
50
To subscribe call 1-800-VALUELINE


