AMAZON.COM NDQ-AMZN
TIMELINESS
SAFETY
TECHNICAL
4
3
2
High:
Low:
Raised 5/11/12
Raised 5/25/07
Raised 8/17/12
BETA 1.05 (1.00 = Market)
2015-17 PROJECTIONS
Ann’l Total
Price
Gain
Return
High 430 (+80%) 16%
Low 285 (+20%)
5%
Insider Decisions
to Buy
Options
to Sell
S
0
0
4
O N
0 0
0 0
0 10
D
0
0
3
J
0
0
0
F
0
0
9
M
0
0
3
A
0
0
0
RECENT
PRICE
22.4
5.5
25.0
9.0
61.2
18.5
NMF RELATIVE
DIV’D
Median: 62.0) P/E RATIO NMF YLD
236.56 P/ERATIONMF(Trailing:
57.8
33.0
50.0
30.6
48.6
25.8
101.1
36.3
97.4
34.7
145.9
47.6
185.6
105.8
246.7
160.6
Nil
240.7
172.0
Target Price Range
2015 2016 2017
LEGENDS
21.0 x ″Cash Flow″ p sh
. . . . Relative Price Strength
3-for-1 split 1/99
2-for-1 split 9/99
Options: Yes
Shaded areas indicate recessions
640
480
400
320
240
200
160
120
M
0
0
9
80
60
% TOT. RETURN 7/12
Institutional Decisions
3Q2011
4Q2011
1Q2012
377
373
386
to Buy
to Sell
348
418
425
Hld’s(000) 311072 295056 297800
VALUE
LINE
Percent
shares
traded
75
50
25
1 yr.
3 yr.
5 yr.
1996 1997 1998 1999 2000 2001 2002 2003 2004 2005 2006 2007 2008 2009 2010 2011 2012 2013
THIS
STOCK
VL ARITH.*
INDEX
4.8
172.0
197.0
-1.0
50.3
24.0
© VALUE LINE PUB. LLC
15-17
.07
.51
1.92
4.75
7.73
8.37 10.14 13.05 17.16 20.41 25.87 35.66 44.78 55.20
d.02
d.08
d.20 d1.02
d.93
d.21
.21
.60
1.05
1.10
.95
1.74
2.07
2.88
d.02
d.11
d.25 d1.19 d1.19
d.44
d.01
.40
.82
.79
.45
1.12
1.39
2.04
--------------.01
.03
.09
.83
.38
.13
.10
.11
.22
.49
.52
.54
.78
.84
.01
.10
.44
.77 d2.71 d3.86 d3.49 d2.57
d.56
.59
1.04
2.88
6.24 11.84
231.80 287.25 318.53 345.16 357.14 373.22 387.91 403.35 403.35 416.00 414.00 416.00 428.00 444.00
-------NMF
NMF
NMF
NMF
NMF
NMF
NMF
-------NMF
NMF
NMF
NMF
NMF
NMF
NMF
---------------
75.84 105.65 139.55 179.10
3.81
3.77
4.15
6.90
2.53
1.37
.80
2.45
--Nil
Nil
2.17
3.98
4.45
4.00
15.22 17.05 16.40 18.85
451.00 455.07 450.00 450.00
NMF
NMF Bold figures are
Value Line
NMF
NMF
estimates
---
Revenues per sh
‘‘Cash Flow’’ per sh
Earnings per sh A
Div’ds Decl’d per sh
Cap’l Spending per sh
Book Value per sh
Common Shs Outst’g B
Avg Ann’l P/E Ratio
Relative P/E Ratio
Avg Ann’l Div’d Yield
350.00
17.60
11.90
Nil
3.35
43.25
450.00
30.0
2.00
Nil
3932.9 5263.7 6921.1 8490.0 10711 14836 19166 24509
4.9%
6.6%
7.3%
7.1%
5.5%
6.1%
5.8%
6.6%
82.3
75.6
75.7 121.0 205.0 246.0 287.0 378.0
d2.4 168.3 348.7 337.9 190.0 476.0 600.0 902.0
LT Debt $1433.0 mill. LT Interest $125.0 mill.
--- - 22.0% 49.6% 27.9% 26.1% 21.8%
Includes $944.0 mill. in capitalized leases.
(16% of Cap’l)
NMF
3.2%
5.0%
4.0%
1.8%
3.2%
3.1%
3.7%
Leases, Uncapitalized: $246.0 mill.
549.7 568.1 919.0 1000.0 841.0 1450.0 1411.0 2433.0
2277.3 1945.4 1855.3 1521.0 1247.0 1282.0 687.0 109.0
No Defined Benefit Pension Plan
d1353 d1036 d227.2 246.0 431.0 1197.0 2672.0 5257.0
7.4% 25.6% 24.7% 21.7% 13.6% 20.8% 18.9% 17.1%
Common Stock 452,065,256 shs.
as of 7/13/12
--- - 137.4% 44.1% 39.8% 22.5% 17.2%
MARKET CAP: $107 billion (Large Cap)
--- - 137.4% 44.1% 39.8% 22.5% 17.2%
CURRENT POSITION 2010
2011 6/30/12
---------
34204 48077
5.8%
4.0%
568.0 1083.0
1152.0 631.0
23.5% 31.2%
3.4%
1.3%
3375.0 2594.0
460.0 853.0
6864.0 7757.0
16.0%
7.7%
16.8%
8.1%
16.8%
8.1%
---
Revenues ($mill)
Operating Margin
Depreciation ($mill)
Net Profit ($mill)
Income Tax Rate
Net Profit Margin
Working Cap’l ($mill)
Long-Term Debt ($mill)
Shr. Equity ($mill)
Return on Total Cap’l
Return on Shr. Equity
Retained to Com Eq
All Div’ds to Net Prof
157500
7.0%
2500
5410
35.0%
3.4%
6455
1500
19470
26.5%
28.0%
28.0%
Nil
CAPITAL STRUCTURE as of 6/30/12
Total Debt $1741.0 mill. Due in 5 Yrs $1638.0 mill.
($MILL.)
Cash Assets
8762
Inventory (Avg Cst) 3202
A/R & Other
1783
Current Assets
13747
Accts Payable
8051
Debt due
-Other
2321
Current Liab.
10372
9576
4992
2922
17490
11145
544
3207
14896
4970
4380
2443
11793
7072
308
3584
10964
ANNUAL RATES Past
Past Est’d ’09-’11
of change (per sh)
10 Yrs.
5 Yrs.
to ’14-’16
Revenues
27.5% 30.0% 28.0%
‘‘Cash Flow’’
- - 27.5% 31.0%
Earnings
- - 23.5% 35.0%
Dividends
--Nil
Book Value
- - 110.5% 19.5%
Calendar
2009
2010
2011
2012
2013
Calendar
2009
2010
2011
2012
2013
Calendar
2008
2009
2010
2011
2012
QUARTERLY REVENUES ($ mill.)
Mar.31 Jun.30 Sep.30 Dec.31
4890 4651 5449 9519
7130 6566 7560 12948
9857 9913 10876 17431
13185 12834 13900 22881
17000 16500 18000 29100
EARNINGS PER SHARE A
Mar.31 Jun.30 Sep.30 Dec.31
.42
.32
.45
.85
.66
.45
.51
.91
.44
.41
.14
.38
.28
.01 d.05
.56
.45
.40
.45
1.15
QUARTERLY DIVIDENDS PAID
Mar.31 Jun.30 Sep.30 Dec.31
NO CASH DIVIDENDS
BEING PAID
(A) Diluted earnings. Excludes goodwill:
(1¢). Includes stock-based compensation:
(19¢); ’03, (21¢); ’04, (14¢); ’05, (20¢);
(24¢); ’07, (44¢); ’08, (64¢); ’09, (77¢).
Full
Year
24509
34204
48077
62800
80600
Full
Year
2.04
2.53
1.37
.80
2.45
Full
Year
62800
3.5%
1500
365
35.0%
.6%
1555
1500
7370
5.0%
5.0%
5.0%
Nil
80600
5.0%
2000
1105
35.0%
1.4%
1860
1500
8475
12.0%
13.0%
13.0%
Nil
BUSINESS: Amazon.com is a large online retailer. Sales breakdown (2011): media (books, music, and videos; 37% of sales),
electronics (60%); other (3%). International sales, 44% of total.
Third-party sellers (Marketplace) account for about 34% of unit
volume. Seasonality: Q4 accounted for 36% of ’11 revenue. Acquired Internet Movie Database, Bookpages, Telebook, ’98; Jun-
glee and PlanetAll, ’98; Exchange.com, Accept.com, Alexa, ’99;
Zappos, ’09. Has about 33,700 employees. Officers/directors own
19.6% of common stock (including Mr. Bezos’ 19.5%) (4/12 proxy).
President, Chairman & CEO: Jeffrey Bezos. Incorporated: Delaware. Address: 410 Terry Avenue North, Seattle, WA 98109-5210.
Telephone: 206-266-1000. Internet: www.amazon.com.
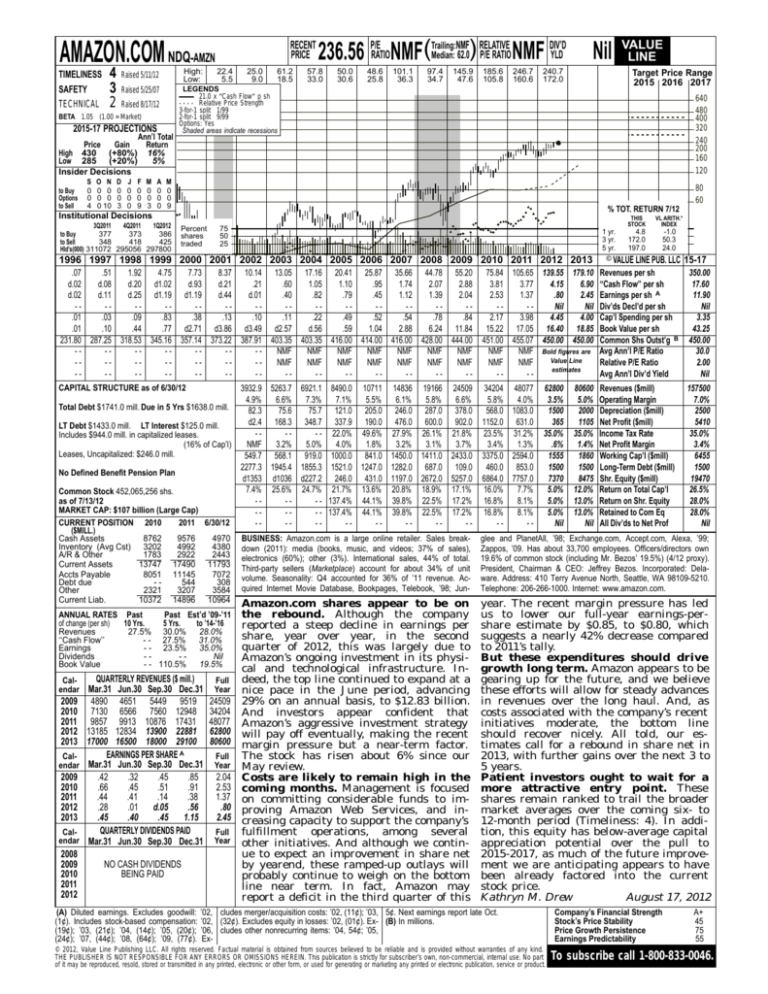
Amazon.com shares appear to be on
the rebound. Although the company
reported a steep decline in earnings per
share, year over year, in the second
quarter of 2012, this was largely due to
Amazon’s ongoing investment in its physical and technological infrastructure. Indeed, the top line continued to expand at a
nice pace in the June period, advancing
29% on an annual basis, to $12.83 billion.
And investors appear confident that
Amazon’s aggressive investment strategy
will pay off eventually, making the recent
margin pressure but a near-term factor.
The stock has risen about 6% since our
May review.
Costs are likely to remain high in the
coming months. Management is focused
on committing considerable funds to improving Amazon Web Services, and increasing capacity to support the company’s
fulfillment operations, among several
other initiatives. And although we continue to expect an improvement in share net
by yearend, these ramped-up outlays will
probably continue to weigh on the bottom
line near term. In fact, Amazon may
report a deficit in the third quarter of this
year. The recent margin pressure has led
us to lower our full-year earnings-pershare estimate by $0.85, to $0.80, which
suggests a nearly 42% decrease compared
to 2011’s tally.
But these expenditures should drive
growth long term. Amazon appears to be
gearing up for the future, and we believe
these efforts will allow for steady advances
in revenues over the long haul. And, as
costs associated with the company’s recent
initiatives moderate, the bottom line
should recover nicely. All told, our estimates call for a rebound in share net in
2013, with further gains over the next 3 to
5 years.
Patient investors ought to wait for a
more attractive entry point. These
shares remain ranked to trail the broader
market averages over the coming six- to
12-month period (Timeliness: 4). In addition, this equity has below-average capital
appreciation potential over the pull to
2015-2017, as much of the future improvement we are anticipating appears to have
been already factored into the current
stock price.
Kathryn M. Drew
August 17, 2012
’02, cludes merger/acquisition costs: ’02, (11¢); ’03, 5¢. Next earnings report late Oct.
’02, (32¢). Excludes equity in losses: ’02, (01¢). Ex- (B) In millions.
’06, cludes other nonrecurring items: ’04, 54¢; ’05,
Ex-
© 2012, Value Line Publishing LLC. All rights reserved. Factual material is obtained from sources believed to be reliable and is provided without warranties of any kind.
THE PUBLISHER IS NOT RESPONSIBLE FOR ANY ERRORS OR OMISSIONS HEREIN. This publication is strictly for subscriber’s own, non-commercial, internal use. No part
of it may be reproduced, resold, stored or transmitted in any printed, electronic or other form, or used for generating or marketing any printed or electronic publication, service or product.
Company’s Financial Strength
Stock’s Price Stability
Price Growth Persistence
Earnings Predictability
A+
45
75
55
To subscribe call 1-800-833-0046.


