27 in text
advertisement
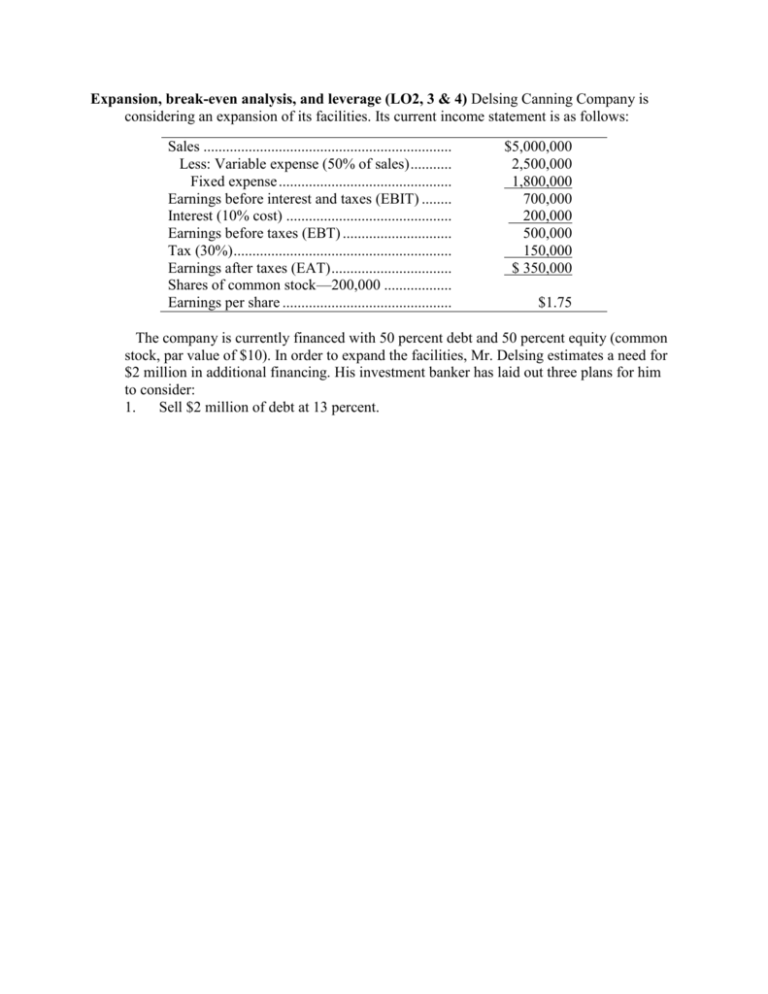
Expansion, break-even analysis, and leverage (LO2, 3 & 4) Delsing Canning Company is considering an expansion of its facilities. Its current income statement is as follows: Sales .................................................................. Less: Variable expense (50% of sales) ........... Fixed expense .............................................. Earnings before interest and taxes (EBIT) ........ Interest (10% cost) ............................................ Earnings before taxes (EBT) ............................. Tax (30%) .......................................................... Earnings after taxes (EAT) ................................ Shares of common stock—200,000 .................. Earnings per share ............................................. $5,000,000 2,500,000 1,800,000 700,000 200,000 500,000 150,000 $ 350,000 $1.75 The company is currently financed with 50 percent debt and 50 percent equity (common stock, par value of $10). In order to expand the facilities, Mr. Delsing estimates a need for $2 million in additional financing. His investment banker has laid out three plans for him to consider: 1. Sell $2 million of debt at 13 percent. 2. 3. Sell $2 million of common stock at $20 per share. Sell $1 million of debt at 12 percent and $1 million of common stock at $25 per share. Variable costs are expected to stay at 50 percent of sales, while fixed expenses will increase to $2,300,000 per year. Delsing is not sure how much this expansion will add to sales, but he estimates that sales will rise by $1 million per year for the next five years. Delsing is interested in a thorough analysis of his expansion plans and methods of financing. He would like you to analyze the following: a. The break-even point for operating expenses before and after expansion (in sales dollars). b. The degree of operating leverage before and after expansion. Assume sales of $5 million before expansion and $6 million after expansion. Use the formula in footnote 2 of the chapter. c. The degree of financial leverage before expansion and for all three methods of financing after expansion. Assume sales of $6 million for this question. d. Compute EPS under all three methods of financing the expansion at $6 million in sales (first year) and $10 million in sales (last year). e. What can we learn from the answer to part d about the advisability of the three methods of financing the expansion? 5-27. Solution: Delsing Canning Company a. At break-even before expansion: PQ FC VC where PQ equals sales volume at break-even point Fixed costs Variable costs (Variable costs 50% of sales) Sales $1,800,000 .50 Sales .50 Sales $1,800,000 Sales Sales $3,600,000 At break-even after expansion: Sales $2,300,000 .50 Sales .50 Sales $2,300,000 $4,600,000 Sales b. Degree of operating leverage, before expansion, at sales of $5,000,000 DOL = Q P VC Q P VC FC S TVC S TVC FC $5,000,000 $2,500,000 $5,000,000 $2,500,000 $1,800,000 $2,500,000 3.57x $700,000 5-27. (Continued) Degree of operating leverage after expansion at sales of $6,000,000 $6,000,000 $3,000,000 $6,000,000 $3,000,000 $2,300,000 $3,000,000 4.29x $700,000 DOL = This could also be computed for subsequent years. c. DFL before expansion: DFL = EBIT EBIT 1 $700,000 $700,000 $200,000 $700,000 1.40x $500,000 DFL after expansion: Compute EBIT and I for all three plans: (100% Debt) (1) Sales $6,000,000 –TVC (.50) 3,000,000 –FC 2,300,000 EBIT $ 700,000 I – Old Debt 200,000 I – New Debt 260,000 Total Interest $ 460,000 5-27. (Continued) DFL = (100% Equity) (2) $6,000,000 3,000,000 2,300,000 $ 700,000 200,000 0 $ 200,000 (50% Debt and 50% Equity) (3) $6,000,000 3,000,000 2,300,000 $ 700,000 200,000 120,000 $ 320,000 EBIT EBIT I (1) (2) (3) $700,000 $700,000 $700,000 $700,000 $460,000 $700,000 $200,000 $700,000 $320,000 DFL = 2.92x 1.40x d. EPS @ sales of $6,000,000 1.84x (refer back to part c to get the values for EBIT and Total I) EBIT Total I EBT Taxes (30%) EAT Shares (old) Shares (new) Total Shares EPS (EAT/Total shares) (100% Debt) (1) $700,000 460,000 $240,000 72,000 $168,000 200,000 0 200,000 $.84 (50% Debt (100% and 50% Equity) (2) Equity) (3) $700,000 $700,000 200,000 320,000 $500,000 $380,000 150,000 114,000 $350,000 $266,000 200,000 200,000 100,000 40,000 300,000 240,000 $1.17 $1.11 EPS @ sales of $10,000,000 Sales –TVC –FC EBIT Total I EBT Taxes (30%) EAT Total Shares EPS (EAT/Total Shares) (100% Debt) (1) $10,000,000 5,000,000 2,300,000 $ 2,700,000 460,000 $ 2,240,000 672,000 $1,568,000 200,000 (100% Equity) (2) $10,000,000 5,000,000 2,300,000 $ 2,700,000 200,000 $ 2,500,000 750,000 $1,750,000 300,000 (50% Debt and 50% Equity) (3) $10,000,000 5,000,000 2,300,000 $ 2,700,000 320,000 $2,380,000 714,000 $1,666,000 240,000 $7.84 $5.83 $6.94 e. In the first year, when sales and profits are relatively low, plan 2 (100% equity) appears to be the best alternative. However, as sales expand up to $10 million, financial leverage begins to produce results as EBIT increases and Plan 1 (100% debt) is the highest yielding alternative.
