BUD - University of Connecticut
advertisement
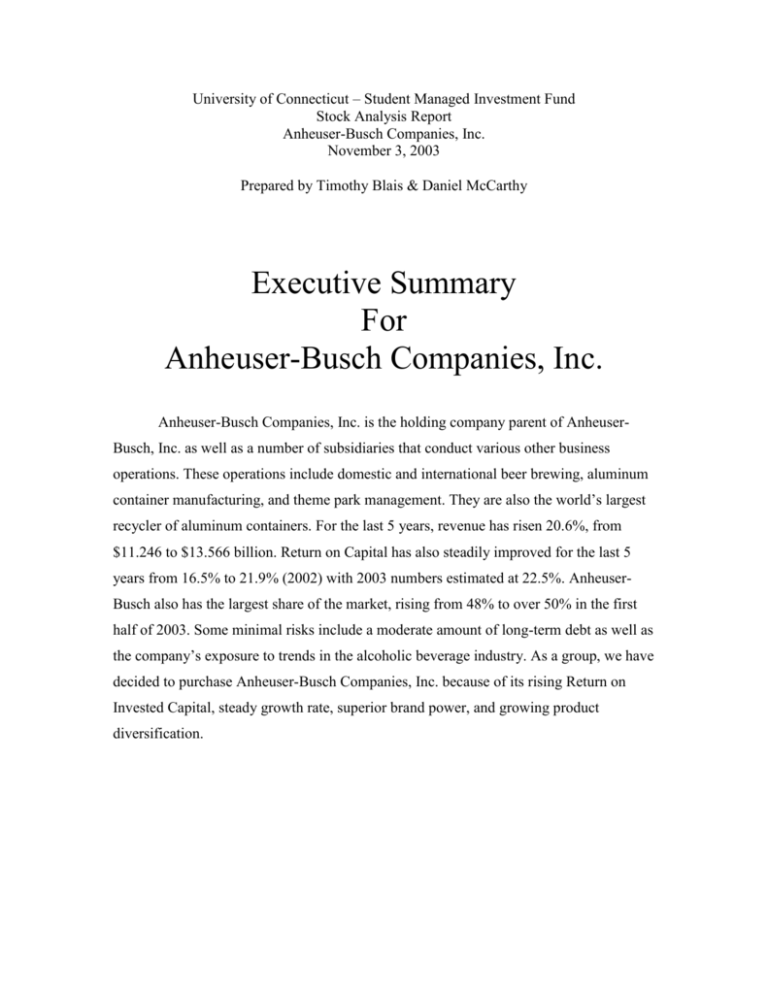
University of Connecticut – Student Managed Investment Fund Stock Analysis Report Anheuser-Busch Companies, Inc. November 3, 2003 Prepared by Timothy Blais & Daniel McCarthy Executive Summary For Anheuser-Busch Companies, Inc. Anheuser-Busch Companies, Inc. is the holding company parent of AnheuserBusch, Inc. as well as a number of subsidiaries that conduct various other business operations. These operations include domestic and international beer brewing, aluminum container manufacturing, and theme park management. They are also the world’s largest recycler of aluminum containers. For the last 5 years, revenue has risen 20.6%, from $11.246 to $13.566 billion. Return on Capital has also steadily improved for the last 5 years from 16.5% to 21.9% (2002) with 2003 numbers estimated at 22.5%. AnheuserBusch also has the largest share of the market, rising from 48% to over 50% in the first half of 2003. Some minimal risks include a moderate amount of long-term debt as well as the company’s exposure to trends in the alcoholic beverage industry. As a group, we have decided to purchase Anheuser-Busch Companies, Inc. because of its rising Return on Invested Capital, steady growth rate, superior brand power, and growing product diversification. Student Managed Fund Stock Research Report By Timothy Blais & Daniel McCarthy Business Summary Anheuser-Busch Companies, Inc. NYSE (BUD) Market Cap: $40 billion Industry: Alcoholic Beverages Sector: Consumer/Non-Cyclical Valueline: Timeliness 3 Safety 1 Technical 3 Anheuser-Busch has the strongest share of the alcoholic beverage market. Major competitors include Adolph Coors and Miller Brewing Company. Significant brands include Budweiser, Michelob, Busch, Natural Light, O’Doul’s, and others. Return on Invested Capital has not fallen below 14% in the last 10 years. Recent financial trends include reducing long-term debt, repurchasing of common stock, and steadily increasing market share overseas. Through joint venture agreement with Tsingtao Brewery, the largest brewer in China, Anheuser-Busch plans to increase interest in Tsingtao from its current level of 4.5% to 27% by 2010. This is a beneficial strategy because the Chinese beer market may be the largest market in the world. The company is also expanding domestically with the launch of Michelob Ultra, a lowcarbohydrate beer. This new product appeals to the growing health consciousness of the American public. In closing, Anheuser-Busch has been a historically stable company with a Valueline rating of A++ and will continue its stability and growth into the distant future. Ratio Analysis Currently, dividend yields are lower than the S&P average, yet still greater than those of its greatest competitor, Adoph Coors, Inc. However, over the last 5 years, BUD has led the industry in dividend yields. Dividends RKY BUD Industry Sector S&P 500 Dividend Yield 1.46 1.79 1.77 2.43 2.05 Dividend Yield - 5 Year Avg. 1.20 1.50 1.40 2.11 1.39 Dividend 5 Year Growth Rate 8.32 8.45 8.15 6.91 6.48 18.80 32.67 29.96 38.58 27.55 Payout Ratio (TTM) Student Managed Fund Stock Research Report By Timothy Blais & Daniel McCarthy Growth for BUD is steady, however having the majority of the market share leads to less growth opportunity than RKY. This is not necessarily bad however when considering each companies capital spending. Over the past five years, BUD has lowered its capital spending while still growing strong, while RKY has extensive spending with only a minimal comparative growth advantage over BUD. Growth Rates(%) RKY BUD Industry Sector S&P 500 Sales (MRQ) vs Qtr. 1 Yr. Ago 3.93 4.70 7.34 7.61 13.31 Sales (TTM) vs TTM 1 Yr. Ago 17.80 4.99 6.97 6.80 11.38 Sales - 5 Yr. Growth Rate 13.65 4.16 5.80 3.86 9.72 EPS (MRQ) vs Qtr. 1 Yr. Ago 31.66 12.20 8.61 8.12 23.26 EPS (TTM) vs TTM 1 Yr. Ago 0.81 13.67 13.25 15.93 21.84 15.38 13.27 13.60 9.59 10.38 Capital Spending - 5 Yr. Growth Rate 32.53 -6.99 -0.81 -0.87 5.96 EPS - 5 Yr. Growth Rate There is some concern over Busch’s debt ratios. They have higher than average debt when compared to the industry and RKY. However, this debt is rationalized by long term investments. We expect a decline in these ratios because Busch is consistently paying off its debt over the years. Financial Strength Quick Ratio (MRQ) RKY BUD Industry Sector S&P 500 .75 0.49 0.56 0.64 1.26 Current Ratio (MRQ) 1.04 0.85 1.14 1.25 1.79 LT Debt to Equity (MRQ) 1.26 2.71 2.30 1.11 0.66 Total Debt to Equity (MRQ) 1.34 2.71 2.33 1.35 0.98 Interest Coverage (TTM) 3.06 8.00 9.96 19.31 12.96 Student Managed Fund Stock Research Report By Timothy Blais & Daniel McCarthy Profit margins for BUD outperform both the industry and the S&P. Net Profit Margin for the last 5 years has been more than double that of its largest competitor, RKY. Profitability Ratios (%) RKY BUD Industry Sector S&P 500 Gross Margin (TTM) 35.19 40.41 40.08 45.39 47.17 Gross Margin - 5 Yr. Avg. 36.55 37.91 38.32 45.97 46.65 EBITD Margin (TTM) 12.82 28.69 25.68 19.74 18.91 EBITD - 5 Yr. Avg. 11.85 26.70 24.25 19.30 20.67 Operating Margin (TTM) 6.71 22.51 20.17 17.10 18.73 Operating Margin - 5 Yr. Avg. 6.34 20.25 18.50 15.91 17.70 Pre-Tax Margin (TTM) 5.35 19.83 17.74 16.20 16.91 Pre-Tax Margin - 5 Yr. Avg. 6.81 17.71 16.24 14.89 17.14 Net Profit Margin (TTM) 4.02 12.18 11.01 10.90 11.73 Net Profit Margin - 5 Yr. Avg. 4.26 10.80 9.96 9.88 11.25 Effective Tax Rate (TTM) 31.13 38.58 37.68 31.68 31.37 Effective Tax Rate - 5 Yr. Avg. 37.60 38.97 38.58 34.68 34.83 Looking at both current and past data, we can see the Anheuser-Busch is outperforming both the market and RKY by large margins. ROE, ROA, and ROI are all performing in the top of the sector. This is an indication of management’s strong performance. Management Effectiveness (%) RKY BUD Industry Sector S&P 500 Return On Assets (TTM) 3.78 12.01 10.93 11.13 6.12 Return On Assets - 5 Yr. Avg. 6.08 10.31 9.81 10.75 7.19 Return On Investment (TTM) 5.00 13.87 12.97 15.93 9.64 Return On Investment - 5 Yr. Avg. 8.22 11.91 11.73 16.14 11.66 Return On Equity (TTM) 15.01 68.73 56.83 34.31 17.86 Return On Equity - 5 Yr. Avg. 12.51 39.77 34.64 31.32 20.04 Student Managed Fund Stock Research Report By Timothy Blais & Daniel McCarthy BUD is efficiently utilizing labor when compared to RKY. Also, inventory is being managed well within BUD as inferred from high turnover rates. Efficiency Revenue/Employee (TTM) Net Income/Employee (TTM) Receivable Turnover (TTM) Inventory Turnover (TTM) Asset Turnover (TTM) RKY BUD 693,085 605,316 Industry 387,886 530,327 27,858 73,723 63,562 42,566 138,628 6.04 17.28 14.91 12.38 10.16 13.40 15.06 12.68 6.97 9.96 .94 0.99 1.00 1.14 0.93 CAPM k=rf +β(rm-rf) 4.38% + (0.6 x 5.5%) = 7.68% P/E Avg P/E: 23 Expected EPS (VLIS)= $2.80 5-Year Horizon: $3.40 P/E Ratio: 24 Projected high price for the next 5 years: $3.40 * 24 = $81.6 Lowest price in the last 5 years: $30 Buy Price: $49.80 Intrinsic Value: $75.56 Growth Rate: 10% Risk Free Rate: 5% WACC: 6.45% S&P 500 566,172 Stock Value Valuepro.net Sector Student Managed Fund Stock Research Report By Timothy Blais & Daniel McCarthy Valueline Model Long Term Debt + Shareholder Equity = 6455 + 3505 = 10600 Growth Rate = 12% Return on Invested Capital = 23% Shares Outstanding = 790 million P/E = 20.8 Future Price = (10600 x 1.12^10) / 790 x .23 x 20.8 = 199.37 Discount Future Price at 15% - 1.7% (Dividend Yield) for 10 years 199.37/1.133^10 = $57.19 Board of Directors August A. Busch III Carlos Fernandez G. James R. Jones Andrew C. Taylor Douglas A. Warner III John E. Jacob Charles F. Knight Joyce M. Roch´e Henry Hugh Shelton Patrick T. Stokes Insider Trading Most recent insider trades are conducted by August Busch IV, who is one of the company’s primary shareholders. Recent sell orders by him raise minimal red flags, but are something worth noting. Let it also be noted that no one entity owns more than 5% of the common stock. Date 14-Aug-03 Insider BUSCH, AUGUST A. IV Shares Transaction Value* 50,000 Option Exercise at $25.2657 per share. $1,263,285 50,000 Sale at $51.75 - $51.92 per share. $2,592,0002 50,000 Sale at $51.85 - $51.97 per share. $2,596,0002 50,000 Option Exercise at $29.9688 per share. $1,498,440 50,000 Planned Sale $2,605,5001 Vice President 14-Aug-03 BUSCH, AUGUST A. IV Vice President 13-Aug-03 BUSCH, AUGUST A. IV Vice President 13-Aug-03 BUSCH, AUGUST A. IV Vice President 13-Aug-03 BUSCH, AUGUST A. IV Student Managed Fund Stock Research Report By Timothy Blais & Daniel McCarthy Vice President 8-Aug-03 SELLINGER, JOSEPH P. Option Exercise at $20.3438 - $21.6875 per share. $110,0002 Disposition (Non Open Market) at $0 per share. N/A 8,132 Option Exercise at $12.0185 per share. $97,734 1,825 Disposition (Non Open Market) at $53.56 per share. $97,747 34,000 Sale at $52.5813 per share. $1,787,764 26,432 Option Exercise at $12.018 per share. $317,659 26,432 Sale at $52.70 - $52.76 per share. $1,394,0002 5,214 Vice President 1-Aug-03 BUSCH, AUGUST A. IV 155 Vice President 16-Jun-03 STOKES, PATRICK T. Chief Executive Officer 16-Jun-03 STOKES, PATRICK T. Chief Executive Officer 6-Jun-03 LAMBRIGHT, STEPHEN K. Vice President 6-Jun-03 BURROWS, STEPHEN J. Vice President 6-Jun-03 BURROWS, STEPHEN J. Vice President Risk Factors Anheuser Busch has a stronghold in the alcoholic beverage market; however there is always the risk of market share growth by competitors. Investments and joint-ventures overseas leave the company open to exchange rate risk and sovereignty risk, especially in China. Stricter government regulation over bars and restaurants, such as serving hours and customer ages, can lead to changes in sales for the company. Also, stricter laws on drunk driving can result in less consumer consumption. Large amounts of debt means that the company has a higher risk of bankruptcy.
