UV-Vis and Fluorescence
advertisement
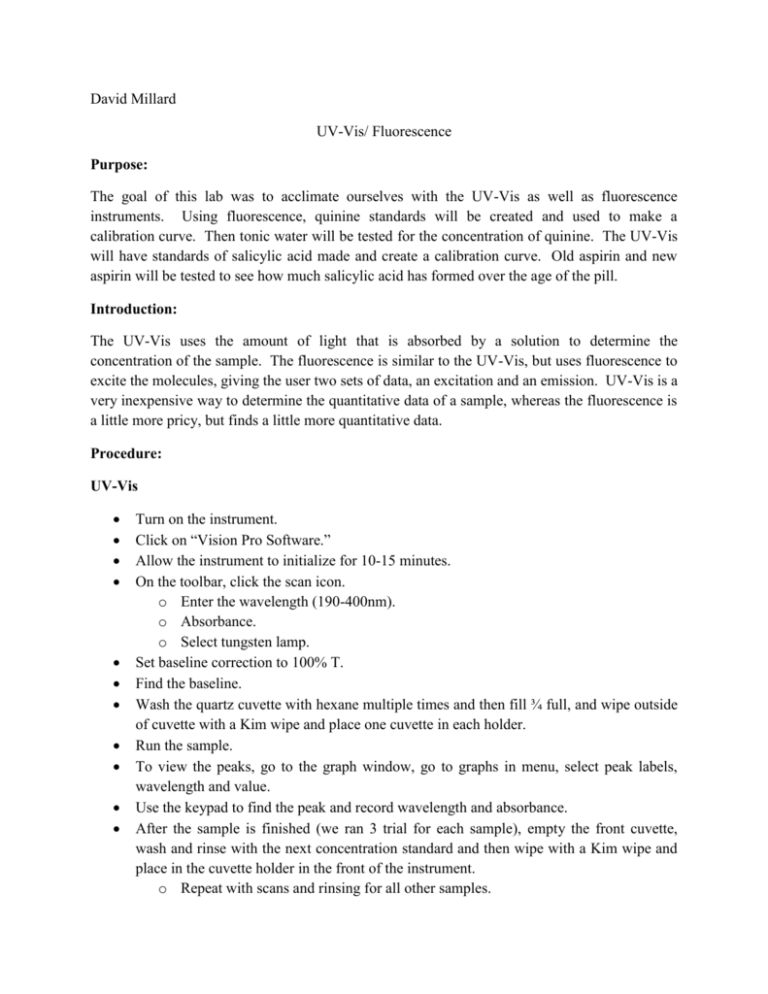
David Millard UV-Vis/ Fluorescence Purpose: The goal of this lab was to acclimate ourselves with the UV-Vis as well as fluorescence instruments. Using fluorescence, quinine standards will be created and used to make a calibration curve. Then tonic water will be tested for the concentration of quinine. The UV-Vis will have standards of salicylic acid made and create a calibration curve. Old aspirin and new aspirin will be tested to see how much salicylic acid has formed over the age of the pill. Introduction: The UV-Vis uses the amount of light that is absorbed by a solution to determine the concentration of the sample. The fluorescence is similar to the UV-Vis, but uses fluorescence to excite the molecules, giving the user two sets of data, an excitation and an emission. UV-Vis is a very inexpensive way to determine the quantitative data of a sample, whereas the fluorescence is a little more pricy, but finds a little more quantitative data. Procedure: UV-Vis Turn on the instrument. Click on “Vision Pro Software.” Allow the instrument to initialize for 10-15 minutes. On the toolbar, click the scan icon. o Enter the wavelength (190-400nm). o Absorbance. o Select tungsten lamp. Set baseline correction to 100% T. Find the baseline. Wash the quartz cuvette with hexane multiple times and then fill ¾ full, and wipe outside of cuvette with a Kim wipe and place one cuvette in each holder. Run the sample. To view the peaks, go to the graph window, go to graphs in menu, select peak labels, wavelength and value. Use the keypad to find the peak and record wavelength and absorbance. After the sample is finished (we ran 3 trial for each sample), empty the front cuvette, wash and rinse with the next concentration standard and then wipe with a Kim wipe and place in the cuvette holder in the front of the instrument. o Repeat with scans and rinsing for all other samples. Fluorescence Turn on the instrument. Open “PX-150x” program on the desktop. Menu – Configure – PC Configure – Port 1. Menu – Configure – Select instrument – on. Set to quantitative analysis – Acquire mode in menu and select spectrum. Obtain a stock solution and dilute to the designated standards. o Wash quartz cuvette with the standard you will be using multiple times before running the sample. Go to parameters – configure – parameters. o Spectrum type: excitation o Scan speed: fast o FM wavelength: 400nm o Record range: -10.00 to 500 o FX wave range: 200 – 900 o Ex/Em slit width: 10/10 o Sensitivity: Low o Response time: 0.2 Run the sample. After first run, click search lambda. o The range of the absorbance Ex: 230-450nm Em: 240-650nm Search for optimal wavelengths for Ex and Em. Change parameters – configure – parameters o Spectrum type to emission o Excitation wavelength to the optimal found o Be sure emission wavelength range encompasses the optimal emission wavelength found. Run other samples, record the wavelength and intensity of the largest peak. o To view peak, go to the menu, manipulate – peak pick. Expand the window. Data: Fluorescence Standards were diluted from a 1000ppm stock solution of quinine. (1000ppm)(V1) = (50mL)(1ppm) V1 = 0.050mL (1000ppm)(V1) = (50mL)(2ppm) V1 = 0.100mL (1000ppm)(V1) = (50mL)(3ppm) V1 = 0.150mL (1000ppm)(V1) = (50mL)(4ppm) V1 = 0.200mL (1000ppm)(V1) = (50mL)(5ppm) V1 = 0.250mL Standard Conc. 5ppm 4ppm 3ppm 2ppm 1ppm Blank Unknown Excitation 363nm Wavelength nm (avg.) Intensity (avg.) 360 15.639 359.67 7.9.5 359.3 74.6 359 8.19 359 9.512 359 7.40 359.67 11.339 Emission 448nm Wavelength nm (avg.) Intensity (avg.) 449.3 978.911 447.3 822.9313 447.67 499.0217 447 403.4177 448 209.584 411 1.421 449 447.8413 Calibration Curve y = 195.94x + 34.835 R² = 0.9792 1200 Intensity 1000 800 600 400 200 0 0 1 2 3 Concentration (ppm) 4 5 6 The unknown was tonic water which was diluted to a 5% solution with the 0.1M sulfuric acid. y=195.94x+34.835 average intensity 447.8413 Calculated concentration of quinine is 2.108 ppm for a 5% solution. For the bottle, 42.16ppm was quinine. UV-Vis Standards were diluted from a 1000ppm stock solution of salicylic acid. (1000ppm)(V1) = (10ppm)(10mL) V1 = 0.1mL (1000ppm)(V1) = (20ppm)(10mL) V1 = 0.2mL (1000ppm)(V1) = (30ppm)(10mL) V1 = 0.3mL (1000ppm)(V1) = (40ppm)(10mL) V1 = 0.4mL (1000ppm)(V1) = (50ppm)(10mL) V1 = 0.5mL Solution Concentration 10ppm 20ppm 30ppm 40ppm 50ppm Blank Aspirin exp. 2006 Aspirin exp. 2010 Lambda average (nm) 310 310 310.67 311.67 312 310 310.33 310 Absorbance average 0.124 0.254 0.334 0.456 0.594 0.000 0.260 0.041 UV-Vis Standards y = 0.0114x + 0.0118 R² = 0.9956 0.7 0.6 Intensity 0.5 0.4 0.3 0.2 0.1 0 0 10 20 30 40 50 60 Concentration (ppm) y = 0.0114x + 0.0118 Aspirin 2006 avg absorbance 0.260 Calculated concentration 21.74ppm Aspirin 2010 avg absorbance 0.041 Calculated concentration 2.53ppm Conclusion: The first day of this lab was a little frustrating. We did not run all of the samples on the UV-Vis because of the non-appearance of data on the computer. Also, on the fluorescence we were getting very strange results with our standards, our blank were a higher intensity than our 1ppm and 2ppm standard. We later found out that we had been using plastic cuvettes instead of the quartz cuvettes. The next day when we ran our samples with the quarts cuvettes, our data was amazing. The lab on the second day seemed to run almost flawlessly. The data we received was very consistent and the running of the instrument was fairly simple. The result of the lab showed that the calculated quinine concentration in the bottle that was tested was 42.16ppm. Also, the aspirin that was tested showed results that were just as nice. The aspirin that had expired in 2006 had a much higher level of salicylic acid than the aspirin that had expired in 2010. The 2006 aspirin had a calculated concentration of 21.74ppm whereas the aspirin that had expired in 2010 had a salicylic acid level much lower, calculated at 2.53ppm.
