click here
advertisement
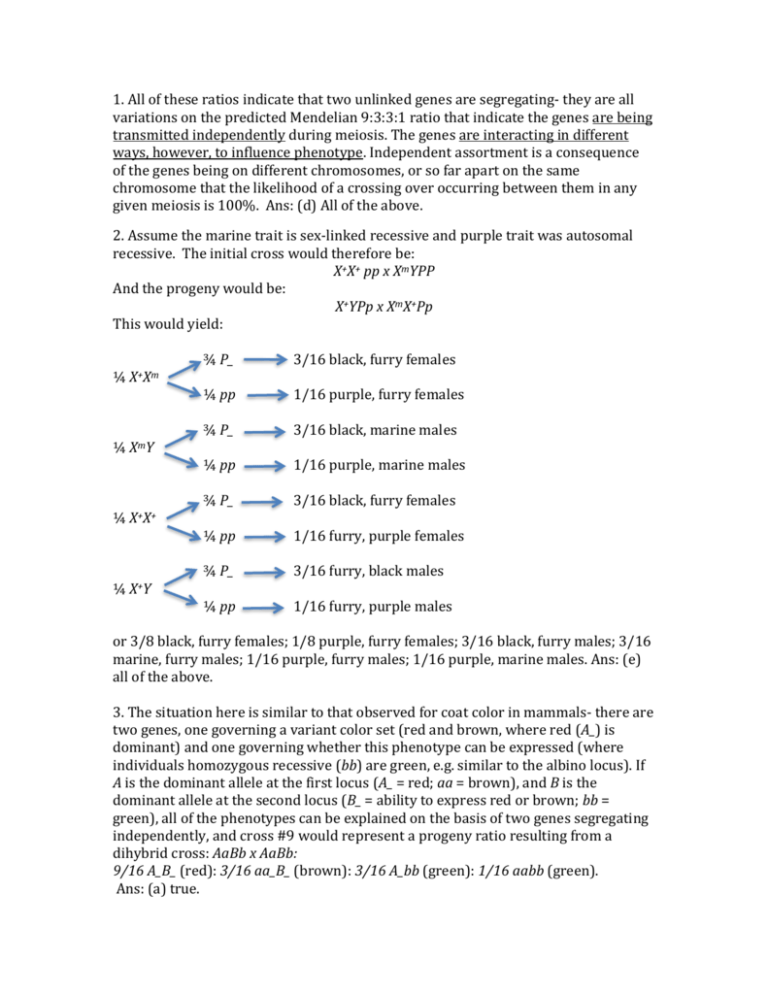
1. All of these ratios indicate that two unlinked genes are segregating- they are all variations on the predicted Mendelian 9:3:3:1 ratio that indicate the genes are being transmitted independently during meiosis. The genes are interacting in different ways, however, to influence phenotype. Independent assortment is a consequence of the genes being on different chromosomes, or so far apart on the same chromosome that the likelihood of a crossing over occurring between them in any given meiosis is 100%. Ans: (d) All of the above. 2. Assume the marine trait is sex-linked recessive and purple trait was autosomal recessive. The initial cross would therefore be: X+X+ pp x XmYPP And the progeny would be: X+YPp x XmX+Pp This would yield: ¼ X+Xm ¼ XmY ¼ X+X+ ¼ X+Y ¾ P_ 3/16 black, furry females ¼ pp 1/16 purple, furry females ¾ P_ 3/16 black, marine males ¼ pp 1/16 purple, marine males ¾ P_ 3/16 black, furry females ¼ pp 1/16 furry, purple females ¾ P_ 3/16 furry, black males ¼ pp 1/16 furry, purple males or 3/8 black, furry females; 1/8 purple, furry females; 3/16 black, furry males; 3/16 marine, furry males; 1/16 purple, furry males; 1/16 purple, marine males. Ans: (e) all of the above. 3. The situation here is similar to that observed for coat color in mammals- there are two genes, one governing a variant color set (red and brown, where red (A_) is dominant) and one governing whether this phenotype can be expressed (where individuals homozygous recessive (bb) are green, e.g. similar to the albino locus). If A is the dominant allele at the first locus (A_ = red; aa = brown), and B is the dominant allele at the second locus (B_ = ability to express red or brown; bb = green), all of the phenotypes can be explained on the basis of two genes segregating independently, and cross #9 would represent a progeny ratio resulting from a dihybrid cross: AaBb x AaBb: 9/16 A_B_ (red): 3/16 aa_B_ (brown): 3/16 A_bb (green): 1/16 aabb (green). Ans: (a) true. 4. cross #3: AaBB x aabb: ½ AaBb: ½ aaBb; cross # 10: AaBb x aaBb: 3/8 AaB_:1/8 Aabb:3/8 aaB_: 1/8 aabb relevant cross: AaBB x aaBb: ½ AaB_: ½ aaB_ = 1R:1B Ans: (a) 5. f + + p a + f – p interval: ++a: 25 fp+: 20 +++: 3 fpa: 2 total: 50 50/1000 = 0.05 = 5 map units p – a interval: +pa: 81 f++: 74 +++: 3 fpa: 2 total: 160 160/1000 = 0.16 = 16 map units 5 + 16 = 21 m.u. Ans: (d) 6. c.o.c = observed double crossovers/expected double crossovers expected dco = (0.05)(0.16)(1000) = 8 c.o.c = 5/8 = 0.625 Ans: (c) 7. The issue here is… are all these genes linked? We are recovering close ratios for the segregation patterns of genes loci A and B: AB: 34 + 204 = 238 aB AB ab Ab ab: 40 + 210 = 250 Observed: 238 250 250 262 Expected: 250 250 250 250 aB: 41 + 221 = 262 [O-E] 144.0 0.0 0.0 144.0 Ab: 35 + 215 = 250 [O-E] /E total 1000 1000 2 2 0.58 0.00 0.00 0.58 A chi square analysis indicates that the segregation is consistent with the genes independently assorting- they are not showing linkage. The B and C loci, however, appear to be linked: Bc BC bc bC BC: 34 + 41 = 75 Observed: 75 75 425 425 bc: 40 + 35 = 75 Expected: 250 250 250 250 bC: 215 + 210 = 425 [O-E] 2 30625.0 30625.0 30625.0 30625.0 [O-E] 2 /E 122.50 122.50 122.50 122.50 Bc: 221 + 204 = 425 150/1000 = 0.15 = 15 m.u. Ans: (c) 1.15 total 1000 1000 490.00 8. Tetrad Class 1 cd cd ++ ++ 41 spore pairs seg. c seg. d 2 c+ ++ cd +d 5 1 1 PD 3 cd ++ cd ++ 3 2 1 TT 4 c+ cd ++ +d 17 2 2 PD 5 +d c+ c+ +d 1 1 2 TT 6 c+ +d cd ++ 1 2 2 NPD 7 c+ c+ +d +d 1 2 2 TT 69 1 1 NPD For the c gene: ½*(5+3+1+1)/69 = 0.0725 = 7.3 m.u. Ans: (b). For the d gene: ½*(3+17+1+1)/69 = 0.159 = 16 m.u. If on the same side, then we would expect 8.7 m.u. between them. If on opposite sides, then we expect 23.3 m.u. between them –these would be underestimates due to ignoring double crossovers. Distance between both genes: (1/2*(5+17+1)+3(3))/69 = 29.7 m.u. 9. They are on opposite sides of the centromere, with c closest. Ans: (d). 10. The fibrillin-1 gene is the gene responsible for Marfan Syndrome. As discussed in class, this gene is autosomal dominant, pleiotropic (has multiple phenotypic effects), and can show variable expressivity. A quick google search will show it is on chromosome 15 in humans. Ans: all of the above (e).
