Melting and freezing
advertisement
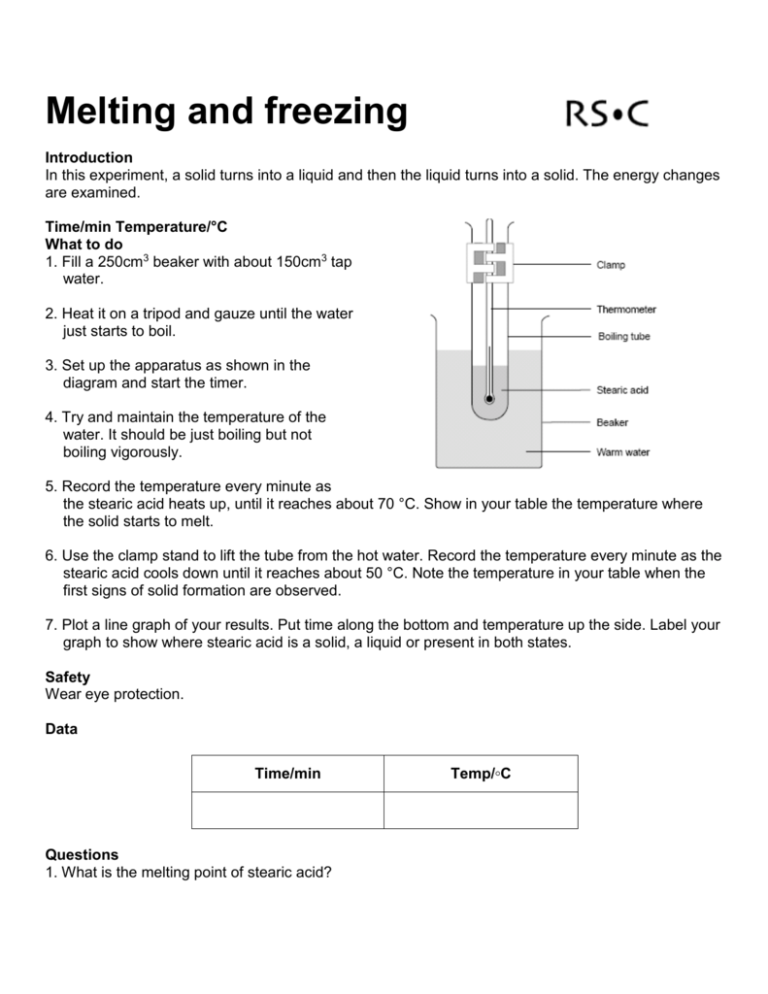
Melting and freezing Introduction In this experiment, a solid turns into a liquid and then the liquid turns into a solid. The energy changes are examined. Time/min Temperature/°C What to do 1. Fill a 250cm3 beaker with about 150cm3 tap water. 2. Heat it on a tripod and gauze until the water just starts to boil. 3. Set up the apparatus as shown in the diagram and start the timer. 4. Try and maintain the temperature of the water. It should be just boiling but not boiling vigorously. 5. Record the temperature every minute as the stearic acid heats up, until it reaches about 70 °C. Show in your table the temperature where the solid starts to melt. 6. Use the clamp stand to lift the tube from the hot water. Record the temperature every minute as the stearic acid cools down until it reaches about 50 °C. Note the temperature in your table when the first signs of solid formation are observed. 7. Plot a line graph of your results. Put time along the bottom and temperature up the side. Label your graph to show where stearic acid is a solid, a liquid or present in both states. Safety Wear eye protection. Data Time/min Questions 1. What is the melting point of stearic acid? Temp/◦C 2. What is the freezing point of stearic acid? 3. Why are there flat sections on your graph? Explain this in terms of the forces between particles. Home
