Heating/Cooling Curves: Phase Changes & Energy
advertisement
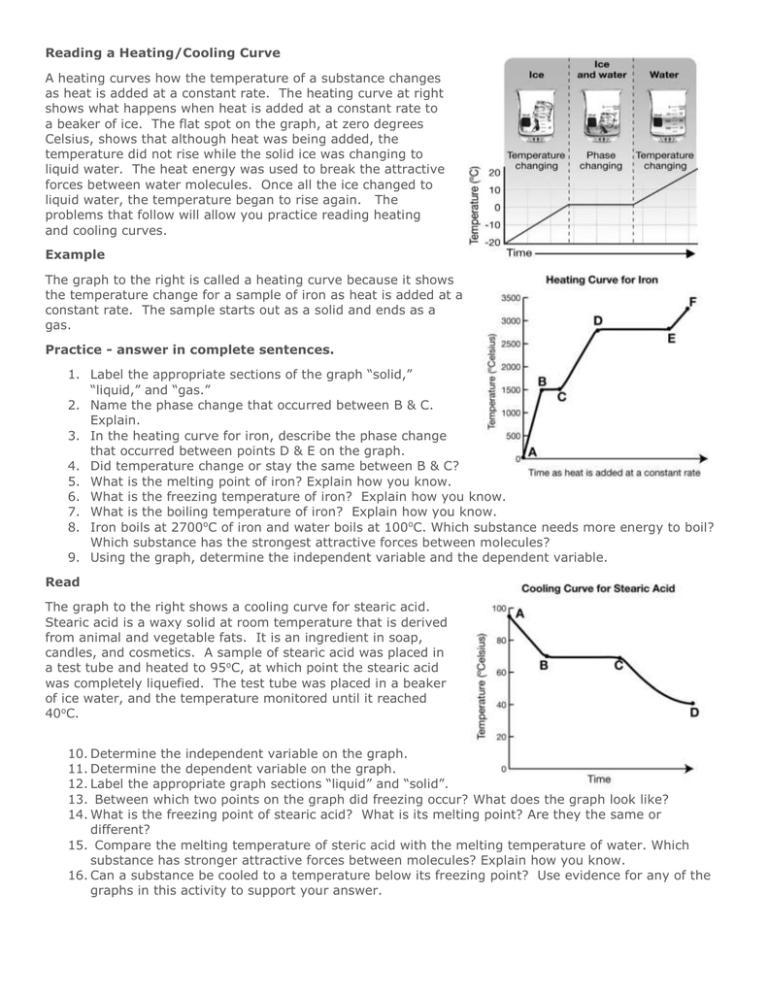
Reading a Heating/Cooling Curve A heating curves how the temperature of a substance changes as heat is added at a constant rate. The heating curve at right shows what happens when heat is added at a constant rate to a beaker of ice. The flat spot on the graph, at zero degrees Celsius, shows that although heat was being added, the temperature did not rise while the solid ice was changing to liquid water. The heat energy was used to break the attractive forces between water molecules. Once all the ice changed to liquid water, the temperature began to rise again. The problems that follow will allow you practice reading heating and cooling curves. Example The graph to the right is called a heating curve because it shows the temperature change for a sample of iron as heat is added at a constant rate. The sample starts out as a solid and ends as a gas. Practice - answer in complete sentences. 1. Label the appropriate sections of the graph “solid,” “liquid,” and “gas.” 2. Name the phase change that occurred between B & C. Explain. 3. In the heating curve for iron, describe the phase change that occurred between points D & E on the graph. 4. Did temperature change or stay the same between B & C? 5. What is the melting point of iron? Explain how you know. 6. What is the freezing temperature of iron? Explain how you know. 7. What is the boiling temperature of iron? Explain how you know. 8. Iron boils at 2700oC of iron and water boils at 100oC. Which substance needs more energy to boil? Which substance has the strongest attractive forces between molecules? 9. Using the graph, determine the independent variable and the dependent variable. Read The graph to the right shows a cooling curve for stearic acid. Stearic acid is a waxy solid at room temperature that is derived from animal and vegetable fats. It is an ingredient in soap, candles, and cosmetics. A sample of stearic acid was placed in a test tube and heated to 95oC, at which point the stearic acid was completely liquefied. The test tube was placed in a beaker of ice water, and the temperature monitored until it reached 40oC. 10. Determine the independent variable on the graph. 11. Determine the dependent variable on the graph. 12. Label the appropriate graph sections “liquid” and “solid”. 13. Between which two points on the graph did freezing occur? What does the graph look like? 14. What is the freezing point of stearic acid? What is its melting point? Are they the same or different? 15. Compare the melting temperature of steric acid with the melting temperature of water. Which substance has stronger attractive forces between molecules? Explain how you know. 16. Can a substance be cooled to a temperature below its freezing point? Use evidence for any of the graphs in this activity to support your answer.
