Interpreting Graphs: Subduction Zone & Temperatures
advertisement
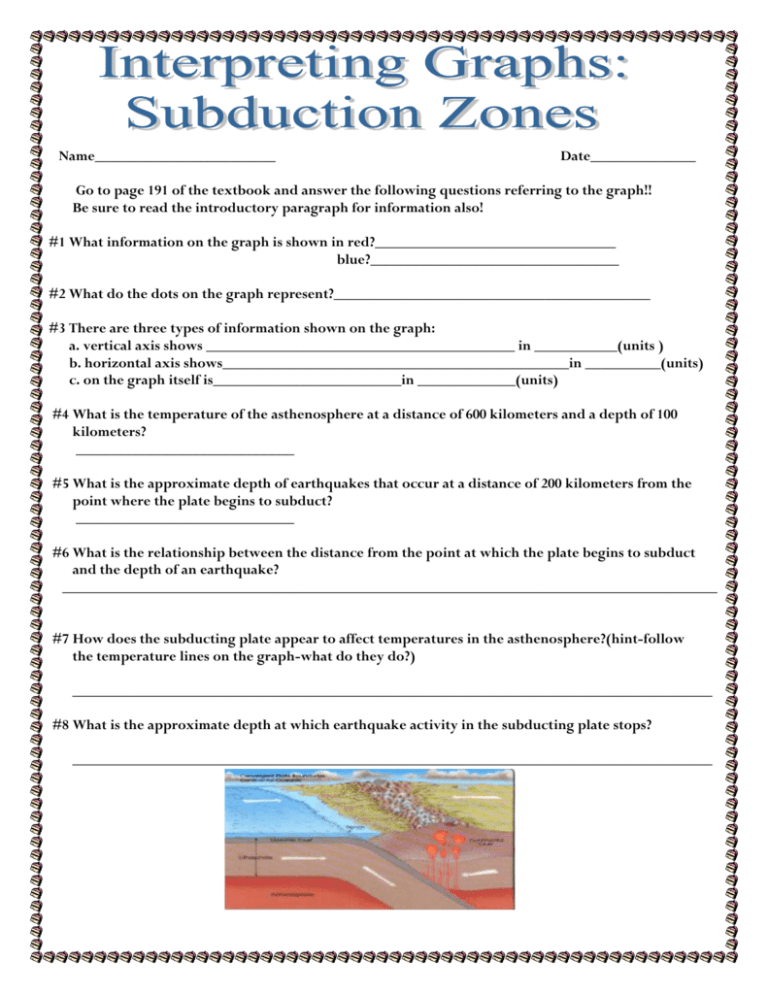
Name________________________ Date______________ Go to page 191 of the textbook and answer the following questions referring to the graph!! Be sure to read the introductory paragraph for information also! #1 What information on the graph is shown in red?________________________________ blue?_________________________________ #2 What do the dots on the graph represent?__________________________________________ #3 There are three types of information shown on the graph: a. vertical axis shows _________________________________________ in ___________(units ) b. horizontal axis shows______________________________________________in __________(units) c. on the graph itself is_________________________in _____________(units) #4 What is the temperature of the asthenosphere at a distance of 600 kilometers and a depth of 100 kilometers? _____________________________ #5 What is the approximate depth of earthquakes that occur at a distance of 200 kilometers from the point where the plate begins to subduct? _____________________________ #6 What is the relationship between the distance from the point at which the plate begins to subduct and the depth of an earthquake? _______________________________________________________________________________________ #7 How does the subducting plate appear to affect temperatures in the asthenosphere?(hint-follow the temperature lines on the graph-what do they do?) _____________________________________________________________________________________ #8 What is the approximate depth at which earthquake activity in the subducting plate stops? _____________________________________________________________________________________

