Chapter 10 SPSS Instructions
advertisement
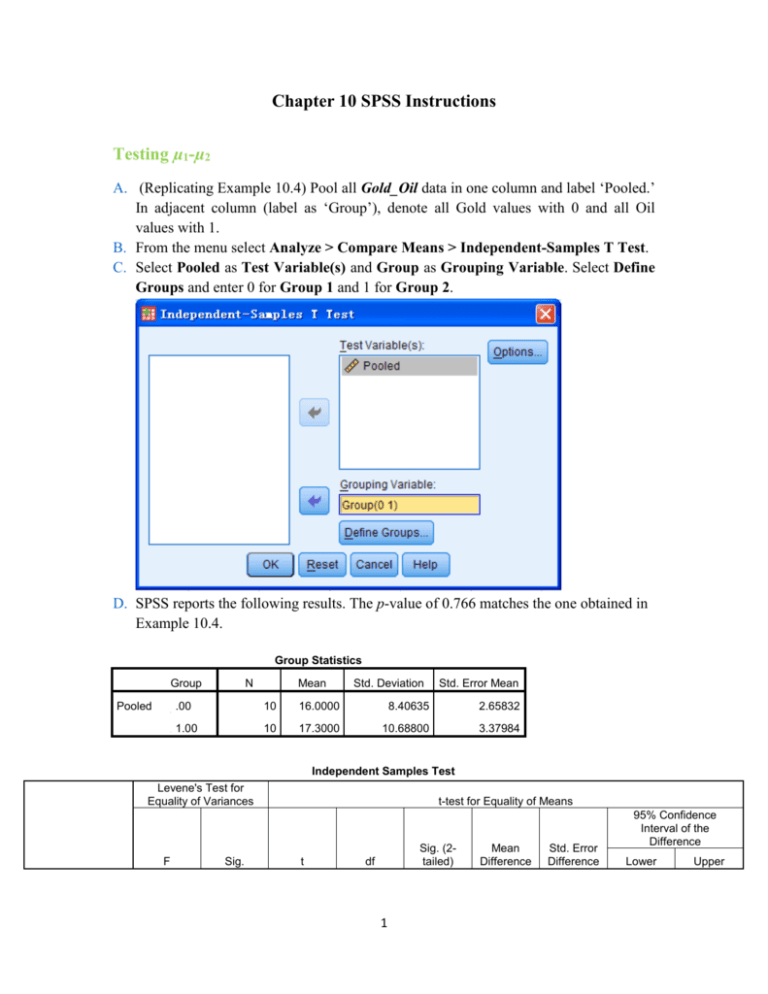
Chapter 10 SPSS Instructions Testing µ1-µ2 A. (Replicating Example 10.4) Pool all Gold_Oil data in one column and label ‘Pooled.’ In adjacent column (label as ‘Group’), denote all Gold values with 0 and all Oil values with 1. B. From the menu select Analyze > Compare Means > Independent-Samples T Test. C. Select Pooled as Test Variable(s) and Group as Grouping Variable. Select Define Groups and enter 0 for Group 1 and 1 for Group 2. D. SPSS reports the following results. The p-value of 0.766 matches the one obtained in Example 10.4. Group Statistics Group Pooled N Mean Std. Deviation Std. Error Mean .00 10 16.0000 8.40635 2.65832 1.00 10 17.3000 10.68800 3.37984 n 1 Independent Samples Test Levene's Test for Equality of Variances F Sig. t-test for Equality of Means t Sig. (2tailed) df 1 Mean Difference Std. Error Difference 95% Confidence Interval of the Difference Lower Upper Pooled Equal variances assumed .699 .414 Equal variances not assumed -.302 18 .766 -1.30000 4.30000 -10.33396 7.73396 -.302 17.053 .766 -1.30000 4.30000 -10.37005 7.77005 Testing µD A. (Replicating Example 10.8) Copy and paste the Food_Calories data from the text website into a SPSS spreadsheet. B. From the menu choose Analyze > Compare Means > Paired-Samples T Test. Select Before as Variable1 and After as Variable2. C. SPSS reports the following results. The value of the test statistic and the p-value, 6.78 and 0.000, match the values produced by Excel in Example 10.8. Paired Samples Test Paired Differences Pair 1 Before After Mean 8.80000 Std. Deviation 8.20944 Std. Error Mean 1.29803 2 95% Confidence Interval of the Difference Lower 6.17449 Upper 11.42551 t 6.780 df 39 Sig. (2tailed) .000 One-Way ANOVA A. (Replicating Example 10.9) Pool all Public_Transportation data in one column and label ‘Pooled.’ In adjacent column (label as ‘Group’), denote all Boston values with 1, all New York values with 2, etc. B. From the menu choose Analyze > Compare Means > One-Way ANOVA. C. Select Pooled as Dependent List and Group as Factor D. SPSS reports the following results. The value of the test statistic and the p-value, 610.57 and 0.000, match the values produced by Excel in Example 10.9. ANOVA Pooled Sum of Squares Between Groups Within Groups Total df Mean Square 1.320E7 3 4401573.333 144180.000 20 7209.000 1.335E7 23 3 F 610.566 Sig. .000
