Using SPSS to Obtain a Confidence Interval for R2 From Regression
advertisement
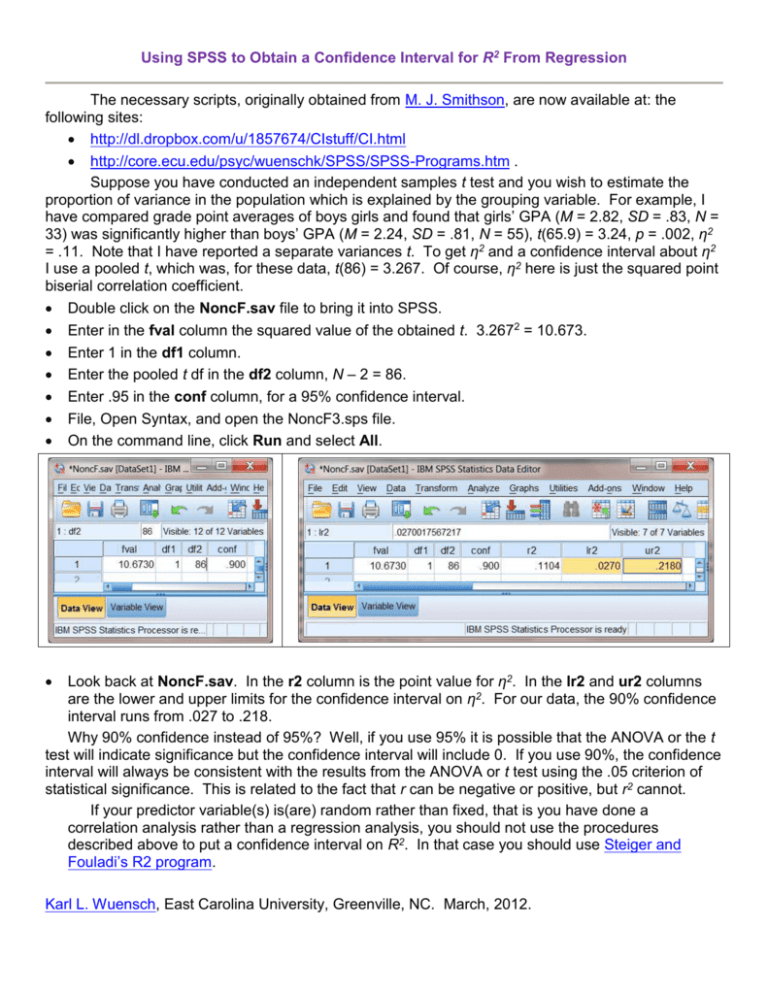
Using SPSS to Obtain a Confidence Interval for R2 From Regression The necessary scripts, originally obtained from M. J. Smithson, are now available at: the following sites: http://dl.dropbox.com/u/1857674/CIstuff/CI.html http://core.ecu.edu/psyc/wuenschk/SPSS/SPSS-Programs.htm . Suppose you have conducted an independent samples t test and you wish to estimate the proportion of variance in the population which is explained by the grouping variable. For example, I have compared grade point averages of boys girls and found that girls’ GPA (M = 2.82, SD = .83, N = 33) was significantly higher than boys’ GPA (M = 2.24, SD = .81, N = 55), t(65.9) = 3.24, p = .002, η2 = .11. Note that I have reported a separate variances t. To get η2 and a confidence interval about η2 I use a pooled t, which was, for these data, t(86) = 3.267. Of course, η2 here is just the squared point biserial correlation coefficient. Double click on the NoncF.sav file to bring it into SPSS. Enter in the fval column the squared value of the obtained t. 3.2672 = 10.673. Enter 1 in the df1 column. Enter the pooled t df in the df2 column, N – 2 = 86. Enter .95 in the conf column, for a 95% confidence interval. File, Open Syntax, and open the NoncF3.sps file. On the command line, click Run and select All. Look back at NoncF.sav. In the r2 column is the point value for η2. In the lr2 and ur2 columns are the lower and upper limits for the confidence interval on η2. For our data, the 90% confidence interval runs from .027 to .218. Why 90% confidence instead of 95%? Well, if you use 95% it is possible that the ANOVA or the t test will indicate significance but the confidence interval will include 0. If you use 90%, the confidence interval will always be consistent with the results from the ANOVA or t test using the .05 criterion of statistical significance. This is related to the fact that r can be negative or positive, but r2 cannot. If your predictor variable(s) is(are) random rather than fixed, that is you have done a correlation analysis rather than a regression analysis, you should not use the procedures described above to put a confidence interval on R2. In that case you should use Steiger and Fouladi’s R2 program. Karl L. Wuensch, East Carolina University, Greenville, NC. March, 2012.


