SPSS T-Test & ANOVA Output Interpretation Guide
advertisement
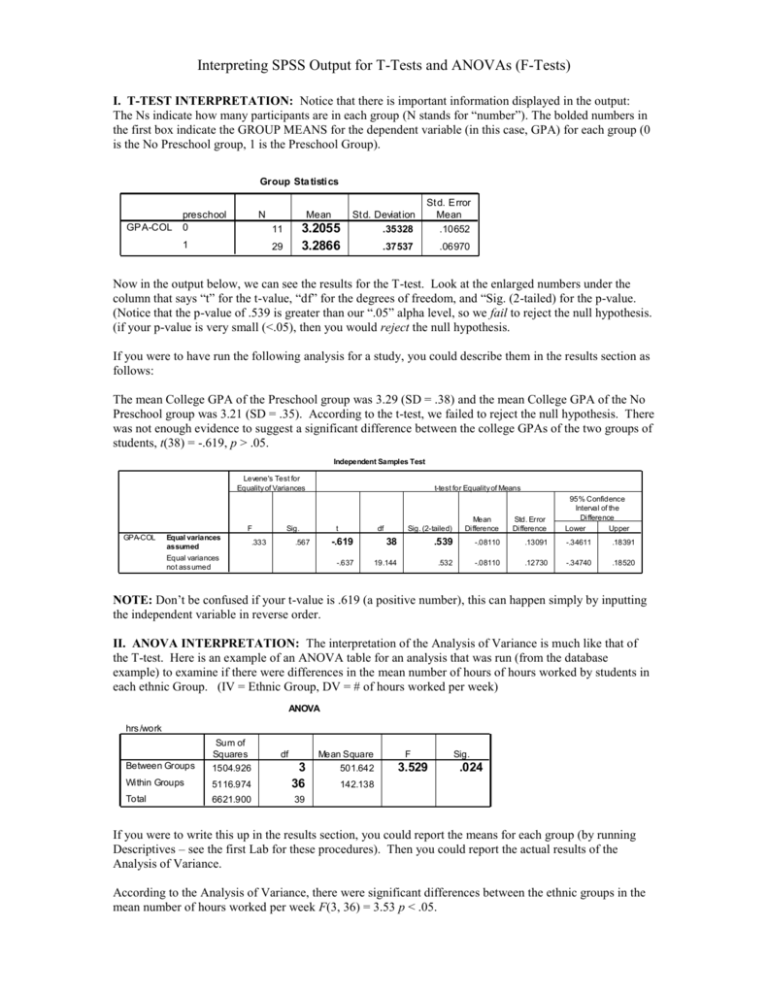
Interpreting SPSS Output for T-Tests and ANOVAs (F-Tests) I. T-TEST INTERPRETATION: Notice that there is important information displayed in the output: The Ns indicate how many participants are in each group (N stands for “number”). The bolded numbers in the first box indicate the GROUP MEANS for the dependent variable (in this case, GPA) for each group (0 is the No Preschool group, 1 is the Preschool Group). Group Sta tisti cs GPA-COL preschool 0 N Mean 3.2055 3.2866 11 1 29 St d. Deviat ion .35328 St d. Error Mean .10652 .37537 .06970 Now in the output below, we can see the results for the T-test. Look at the enlarged numbers under the column that says “t” for the t-value, “df” for the degrees of freedom, and “Sig. (2-tailed) for the p-value. (Notice that the p-value of .539 is greater than our “.05” alpha level, so we fail to reject the null hypothesis. (if your p-value is very small (<.05), then you would reject the null hypothesis. If you were to have run the following analysis for a study, you could describe them in the results section as follows: The mean College GPA of the Preschool group was 3.29 (SD = .38) and the mean College GPA of the No Preschool group was 3.21 (SD = .35). According to the t-test, we failed to reject the null hypothesis. There was not enough evidence to suggest a significant difference between the college GPAs of the two groups of students, t(38) = -.619, p > .05. Independent Samples Test Levene's Test for Equality of Variances F GPA-COL Equal variances assumed Equal variances not ass umed t-test for Equality of Means Sig. .333 t .567 df Sig. (2-tailed) Mean Difference Std. Error Difference 95% Confidence Interval of the Difference Lower Upper -.619 38 .539 -.08110 .13091 -.34611 .18391 -.637 19.144 .532 -.08110 .12730 -.34740 .18520 NOTE: Don’t be confused if your t-value is .619 (a positive number), this can happen simply by inputting the independent variable in reverse order. II. ANOVA INTERPRETATION: The interpretation of the Analysis of Variance is much like that of the T-test. Here is an example of an ANOVA table for an analysis that was run (from the database example) to examine if there were differences in the mean number of hours of hours worked by students in each ethnic Group. (IV = Ethnic Group, DV = # of hours worked per week) ANOVA hrs /work Between Groups Sum of Squares 1504.926 Within Groups 5116.974 3 36 Total 6621.900 39 df Mean Square 501.642 F 3.529 Sig. .024 142.138 If you were to write this up in the results section, you could report the means for each group (by running Descriptives – see the first Lab for these procedures). Then you could report the actual results of the Analysis of Variance. According to the Analysis of Variance, there were significant differences between the ethnic groups in the mean number of hours worked per week F(3, 36) = 3.53 p < .05.


