SPSS Analysis and Tasks
advertisement
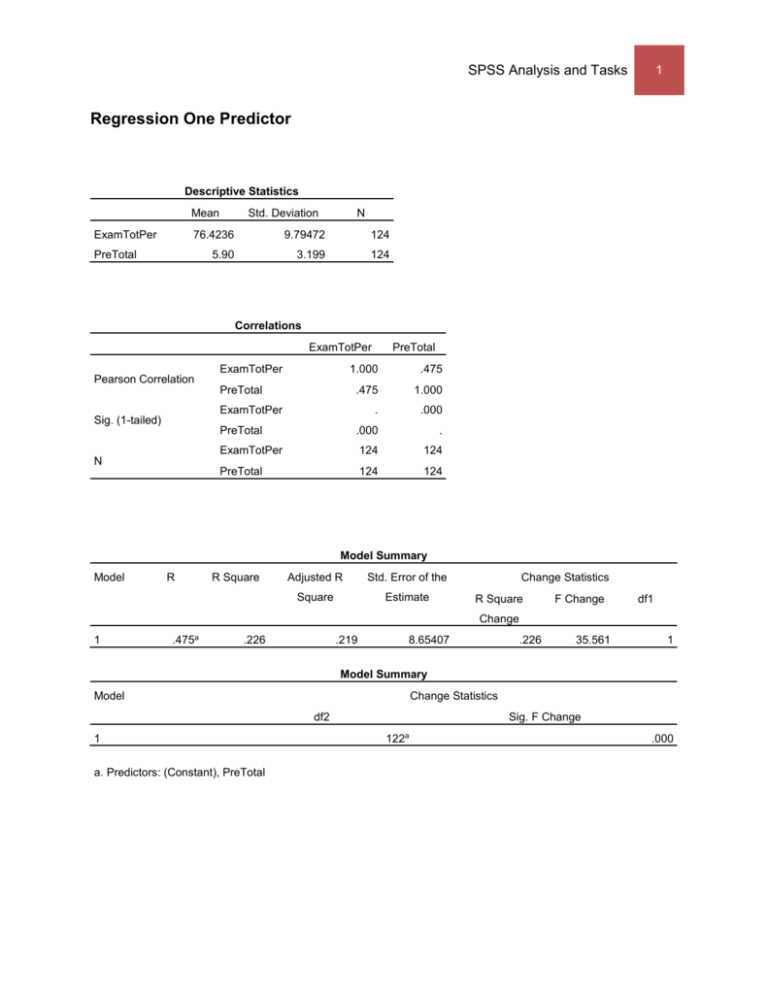
SPSS Analysis and Tasks 1 Regression One Predictor Descriptive Statistics Mean ExamTotPer Std. Deviation N 76.4236 9.79472 124 5.90 3.199 124 PreTotal Correlations ExamTotPer ExamTotPer PreTotal 1.000 .475 .475 1.000 . .000 PreTotal .000 . ExamTotPer 124 124 PreTotal 124 124 Pearson Correlation PreTotal ExamTotPer Sig. (1-tailed) N Model Summary Model R R Square Adjusted R Std. Error of the Square Estimate Change Statistics R Square F Change df1 Change 1 .475a .226 .219 8.65407 .226 35.561 1 Model Summary Model Change Statistics df2 1 a. Predictors: (Constant), PreTotal Sig. F Change 122a .000 SPSS Analysis and Tasks ANOVAa Model 1 Sum of Squares df Mean Square Regression 2663.264 1 2663.264 Residual 9136.928 122 74.893 11800.192 123 Total F Sig. 35.561 .000b a. Dependent Variable: ExamTotPer b. Predictors: (Constant), PreTotal Coefficientsa Model Unstandardized Coefficients Standardized t Sig. Coefficients B (Constant) Std. Error 67.837 1.636 1.455 .244 Beta 41.460 .000 5.963 .000 1 PreTotal a. Dependent Variable: ExamTotPer .475 2 SPSS Analysis and Tasks 3 Regression Two Predictors Descriptive Statistics Mean ExamTotPer Std. Deviation N 76.4236 9.79472 124 5.90 3.199 124 -13.00 26.024 124 PreTotal AbilDis Correlations ExamTotPer ExamTotPer Pearson Correlation N AbilDis 1.000 .475 .283 PreTotal .475 1.000 .137 AbilDis .283 .137 1.000 . .000 .001 PreTotal .000 . .065 AbilDis .001 .065 . ExamTotPer 124 124 124 PreTotal 124 124 124 AbilDis 124 124 124 ExamTotPer Sig. (1-tailed) PreTotal Model Summary Model 1 R .523a R Square .274 Adjusted R Std. Error of the Square Estimate .262 Change Statistics R Square Change 8.41475 .274 F Change df1 df2 Sig. F Change 22.825 2 121 .000 a. Predictors: (Constant), AbilDis, PreTotal ANOVAa Model 1 Sum of Squares df Mean Square Regression 3232.430 2 1616.215 Residual 8567.762 121 70.808 11800.192 123 Total a. Dependent Variable: ExamTotPer b. Predictors: (Constant), AbilDis, PreTotal F 22.825 Sig. .000b SPSS Analysis and Tasks 4 Coefficientsa Model Unstandardized Coefficients Standardized t Sig. Coefficients B (Constant) 1 PreTotal AbilDis Std. Error 69.471 1.692 1.362 .239 .083 .029 Beta 41.056 .000 .445 5.687 .000 .222 2.835 .005 a. Dependent Variable: ExamTotPer Tasks: 1. Use the data from the Excel spreadsheet to demonstrate multiple regression. Note that each individual has a Y score and two X scores that are used as predictor variables. a. Compute the SS values for Y and for both of the X scores, as well as all of the SP values. b. Use these values to compute the coefficients, b1; AbilDis and b2; PreTotal and the constant, a, for the regression equation. 𝑌̂ = 𝑏1 𝑋1 + 𝑏2 𝑋2 + 𝑎 2. Percentage of Variance Accounted For and Residual Variance a. For a regression equation with two predictor variables, use the following equation to compute R2 𝑅2 = 𝑏1 𝑆𝑃𝑋1𝑌 + 𝑏2 𝑆𝑃𝑋2𝑌 𝑆𝑆𝑌 b. Compute R 2 and 1 – R 2 from the residuals i. The value of R 2 can also be obtained indirectly, by computing the residual, or difference between the predicted Y and the actual Y for each individual, then computing the sum of the squared residuals. ii. Explain and interpret your findings. Your explanation should not just be what you are doing but how these specific calculations are used to explain common variance; that is, model based on the relationship versus model based on no relationship. 3. Compute and interpret the standard error of estimate a. The standard error of estimate = √𝑀𝑆𝑟𝑒𝑠𝑖𝑑𝑢𝑎𝑙 SPSS Analysis and Tasks 5 4. Test the significance of the multiple regression equation by calculating values in an ANOVA source table. a. Explain each of the values in the ANOVA source table under the headings: Source, SS, df, MS, Fobs, Fcrit. b. Interpret findings from the ANOVA source table. 5. Evaluate the contribution of each predictor variable a. Compute the correlation between X1-PreTotal and YExamTotal 𝑟= 𝑆𝑃𝑋1𝑌 √(𝑆𝑆𝑋1 )(𝑆𝑆𝑌 ) b. r2 means that the relationship with X1 predicts some percentage of the variance for the Y scores. c. I will add a video to review this process. 6. Interpret the results of the analysis. a. Do findings from the analysis support the notion that pretesting impacts on exam performance? b. How does adding of a second variable, ability discrepancy, extend the findings from the analysis?
