Chemistry of Natural waters: Cations & anions
advertisement
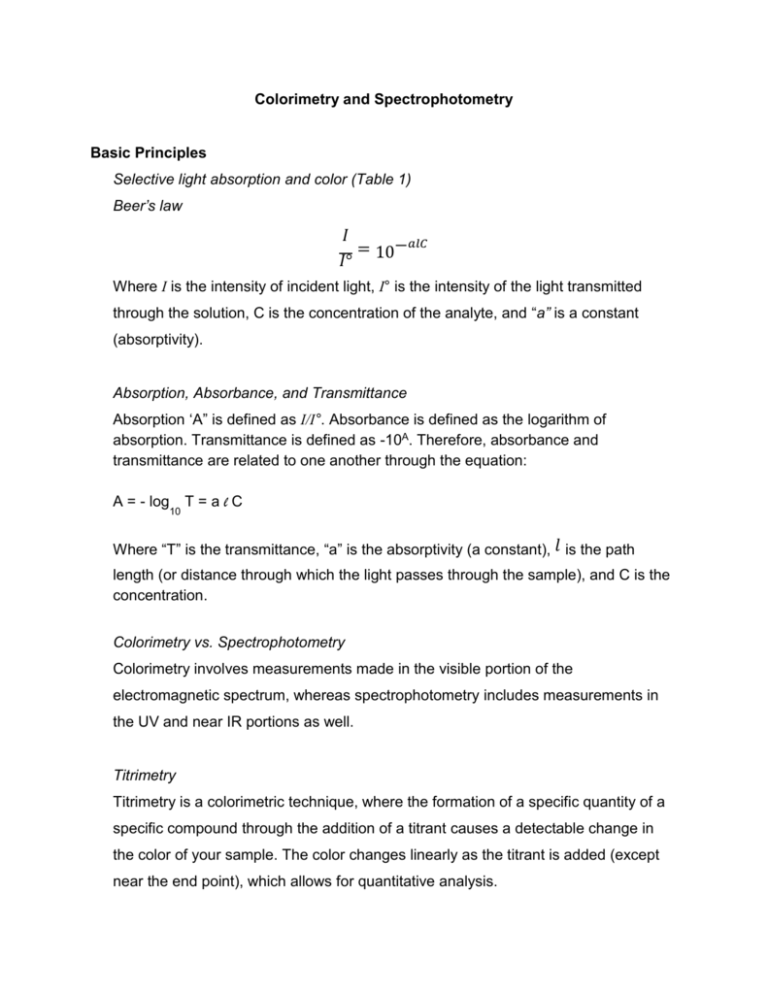
Colorimetry and Spectrophotometry Basic Principles Selective light absorption and color (Table 1) Beer’s law 𝐼 = 10−𝑎𝑙𝐶 𝐼° Where I is the intensity of incident light, I° is the intensity of the light transmitted through the solution, C is the concentration of the analyte, and “a” is a constant (absorptivity). Absorption, Absorbance, and Transmittance Absorption ‘A” is defined as I/I°. Absorbance is defined as the logarithm of absorption. Transmittance is defined as -10A. Therefore, absorbance and transmittance are related to one another through the equation: A = - log 10 T=alC Where “T” is the transmittance, “a” is the absorptivity (a constant), 𝑙 is the path length (or distance through which the light passes through the sample), and C is the concentration. Colorimetry vs. Spectrophotometry Colorimetry involves measurements made in the visible portion of the electromagnetic spectrum, whereas spectrophotometry includes measurements in the UV and near IR portions as well. Titrimetry Titrimetry is a colorimetric technique, where the formation of a specific quantity of a specific compound through the addition of a titrant causes a detectable change in the color of your sample. The color changes linearly as the titrant is added (except near the end point), which allows for quantitative analysis. Spectrophotometric methods Definition of photometry: Measure of the radiant power or relative radiant power of light beams. Components of a spectrophotometer a- Source: a tungsten filament lamp usually works well b- Monochromator c- Absorption cell compartment d- Detector: photovoltaic cell/ photomultiplier e- Readout device Main uses: Spectrophotometry is the technique of choice for the analysis of several non-metals and anionic groups (Table 2). It is also suitable for the analysis of ~ 22 metals, especially when in trace amounts (e.g. Table 3). Keep in mind that spectrophotometry is a very affordable technique. Single vs. double beam instruments Single beam instruments have one optical path from the slit to the sample cell, whereas double beam instruments have two optical paths, one passing through the sample, the other through a blank or a standard cell simultaneously. Double beam instruments therefore have the advantage of compensating for any beam or lamp fluctuations, because beams passing through the sample and standard are simultaneously subjected to the same variations. Optimum concentration ranges and sensitivity The optimum concentration range is determined graphically using a “Ringbom plot” in which log concentration is plotted against transmittance (Fig. 1), and where the linear portion of this plot is considered to be the optimum concentration range. Generally, the absorbance sensitivity of spectrophotometers is ~ 0.001 abs, but this sensitivity varies with wavelength. This sensitivity corresponds to a lower concentration limit of 10-8 moles/ l. The maximum concentration is ~ 0.01 moles/l, beyond which spectrophotometry is not useful. Sources of error: I- Instrument –related a- Slit width is larger than the natural band width of the absorbance maximum: Correction: Use narrow slit width settings. b- Internal reflections from surface of cell: These cause the light to traverse the sample more than once, resulting in higher absorbance. Correction: use longer path-length cells to help minimize this error. c- Stray energy: Correction: Use a double monochromator system. d- Improper calibration: Correction: calibrate at an appropriate wavelength. II- Sample – related a- Interference from elements or compounds b- Chemical reactions resulting from the presence of an interfering ion, which in turn result in the formation of absorbing compounds: Use a complexing agent (masking agent) to suppress this reaction; example: EDTA when determining phosphates. c- Suspended particles: filter sample beforehand if necessary. d- Temperature: work at optimum T. e- pH: work at optimum pH. f- Color stability: this should be well known prior to any measurements.
