Beer-Lambert Law: Spectrophotometry Lab for Blue #1
advertisement
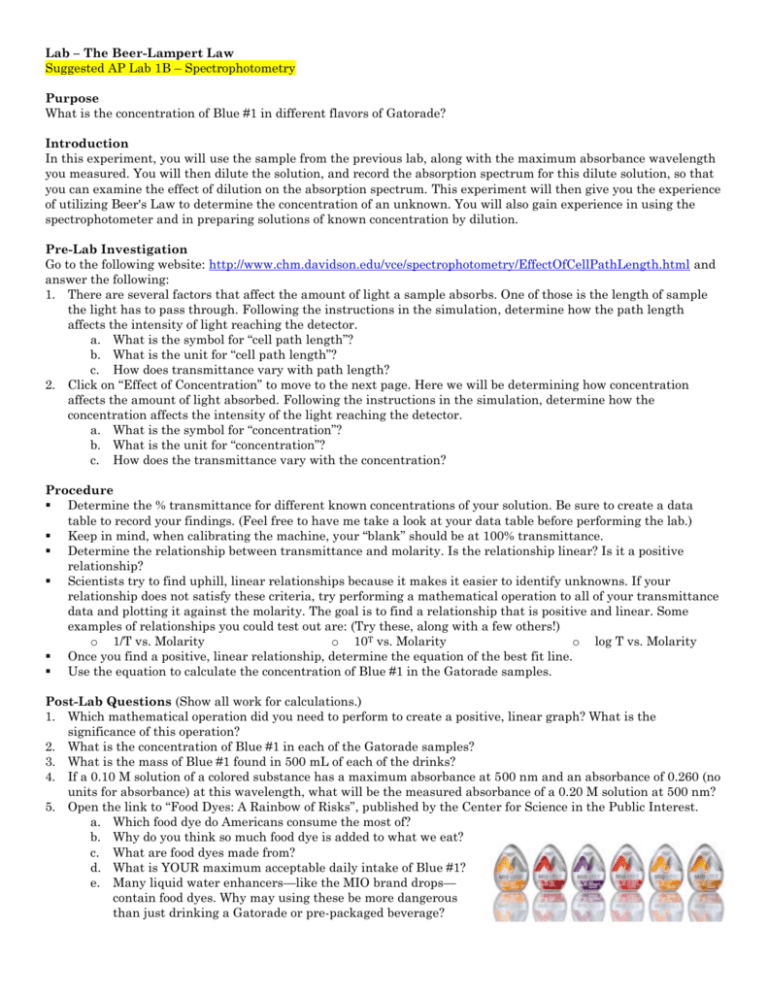
Lab – The Beer-Lampert Law Suggested AP Lab 1B – Spectrophotometry Purpose What is the concentration of Blue #1 in different flavors of Gatorade? Introduction In this experiment, you will use the sample from the previous lab, along with the maximum absorbance wavelength you measured. You will then dilute the solution, and record the absorption spectrum for this dilute solution, so that you can examine the effect of dilution on the absorption spectrum. This experiment will then give you the experience of utilizing Beer's Law to determine the concentration of an unknown. You will also gain experience in using the spectrophotometer and in preparing solutions of known concentration by dilution. Pre-Lab Investigation Go to the following website: http://www.chm.davidson.edu/vce/spectrophotometry/EffectOfCellPathLength.html and answer the following: 1. There are several factors that affect the amount of light a sample absorbs. One of those is the length of sample the light has to pass through. Following the instructions in the simulation, determine how the path length affects the intensity of light reaching the detector. a. What is the symbol for “cell path length”? b. What is the unit for “cell path length”? c. How does transmittance vary with path length? 2. Click on “Effect of Concentration” to move to the next page. Here we will be determining how concentration affects the amount of light absorbed. Following the instructions in the simulation, determine how the concentration affects the intensity of the light reaching the detector. a. What is the symbol for “concentration”? b. What is the unit for “concentration”? c. How does the transmittance vary with the concentration? Procedure Determine the % transmittance for different known concentrations of your solution. Be sure to create a data table to record your findings. (Feel free to have me take a look at your data table before performing the lab.) Keep in mind, when calibrating the machine, your “blank” should be at 100% transmittance. Determine the relationship between transmittance and molarity. Is the relationship linear? Is it a positive relationship? Scientists try to find uphill, linear relationships because it makes it easier to identify unknowns. If your relationship does not satisfy these criteria, try performing a mathematical operation to all of your transmittance data and plotting it against the molarity. The goal is to find a relationship that is positive and linear. Some examples of relationships you could test out are: (Try these, along with a few others!) o 1/T vs. Molarity o 10T vs. Molarity o log T vs. Molarity Once you find a positive, linear relationship, determine the equation of the best fit line. Use the equation to calculate the concentration of Blue #1 in the Gatorade samples. Post-Lab Questions (Show all work for calculations.) 1. Which mathematical operation did you need to perform to create a positive, linear graph? What is the significance of this operation? 2. What is the concentration of Blue #1 in each of the Gatorade samples? 3. What is the mass of Blue #1 found in 500 mL of each of the drinks? 4. If a 0.10 M solution of a colored substance has a maximum absorbance at 500 nm and an absorbance of 0.260 (no units for absorbance) at this wavelength, what will be the measured absorbance of a 0.20 M solution at 500 nm? 5. Open the link to “Food Dyes: A Rainbow of Risks”, published by the Center for Science in the Public Interest. a. Which food dye do Americans consume the most of? b. Why do you think so much food dye is added to what we eat? c. What are food dyes made from? d. What is YOUR maximum acceptable daily intake of Blue #1? e. Many liquid water enhancers—like the MIO brand drops— contain food dyes. Why may using these be more dangerous than just drinking a Gatorade or pre-packaged beverage?
