Probability of Finding an Electron
advertisement
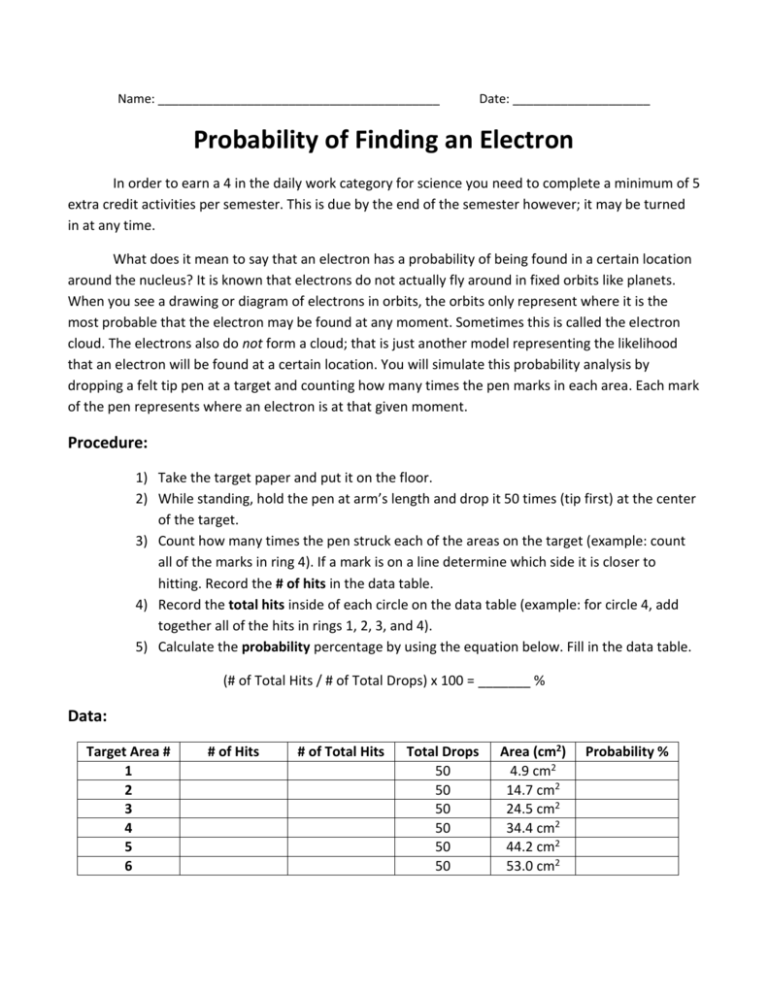
Name: _________________________________________ Date: ____________________ Probability of Finding an Electron In order to earn a 4 in the daily work category for science you need to complete a minimum of 5 extra credit activities per semester. This is due by the end of the semester however; it may be turned in at any time. What does it mean to say that an electron has a probability of being found in a certain location around the nucleus? It is known that electrons do not actually fly around in fixed orbits like planets. When you see a drawing or diagram of electrons in orbits, the orbits only represent where it is the most probable that the electron may be found at any moment. Sometimes this is called the electron cloud. The electrons also do not form a cloud; that is just another model representing the likelihood that an electron will be found at a certain location. You will simulate this probability analysis by dropping a felt tip pen at a target and counting how many times the pen marks in each area. Each mark of the pen represents where an electron is at that given moment. Procedure: 1) Take the target paper and put it on the floor. 2) While standing, hold the pen at arm’s length and drop it 50 times (tip first) at the center of the target. 3) Count how many times the pen struck each of the areas on the target (example: count all of the marks in ring 4). If a mark is on a line determine which side it is closer to hitting. Record the # of hits in the data table. 4) Record the total hits inside of each circle on the data table (example: for circle 4, add together all of the hits in rings 1, 2, 3, and 4). 5) Calculate the probability percentage by using the equation below. Fill in the data table. (# of Total Hits / # of Total Drops) x 100 = _______ % Data: Target Area # 1 2 3 4 5 6 # of Hits # of Total Hits Total Drops 50 50 50 50 50 50 Area (cm2) 4.9 cm2 14.7 cm2 24.5 cm2 34.4 cm2 44.2 cm2 53.0 cm2 Probability % Data Analysis: Please answer these questions on a separate piece of paper in complete sentences. 1) In which ring did the most hits occur? 2) If you dropped your pen one more time, could you assume that it will fall in the ring noted in question #1? Why? 3) Scientists consider the size of the 1s orbital to be the circle in which there is a 90% chance of finding the 1s electron. Which is the smallest circle that contains 90% of your dots (45 dots)? 4) Please graph your results on graph paper. Your graph needs a title. Place the given area on the X-axis and the probability on the Y-axis. Use a smooth line to connect your data points (not dotto-dot straight lines). Your graph also needs a written description stating what relationships or trends are present in the data. Be sure to include two examples present in the data to back up your claim (Example: This graph shows that as a tree gets taller its mass also increases. For example, a tree with the height of 3 meters only has a mass of 132 kilograms while a tree with the height of 21 meters has a mass of 4,391 kilograms) Conclusion: This activity was intended to simulate the probability of finding an electron in a certain energy level. Please write in paragraph form, how does this simulation help you understand where electrons are in an atom? Based on what you have learned which model do you think is a better representation of an atom, one that shows electrons in orbitals or in clouds? Why? Do you have a better way to model electrons in an atom? Draw a diagram of a Carbon atom using what you think is the best model or representation of where electrons are found.
