grl52465-sup-0002-supplementary
advertisement
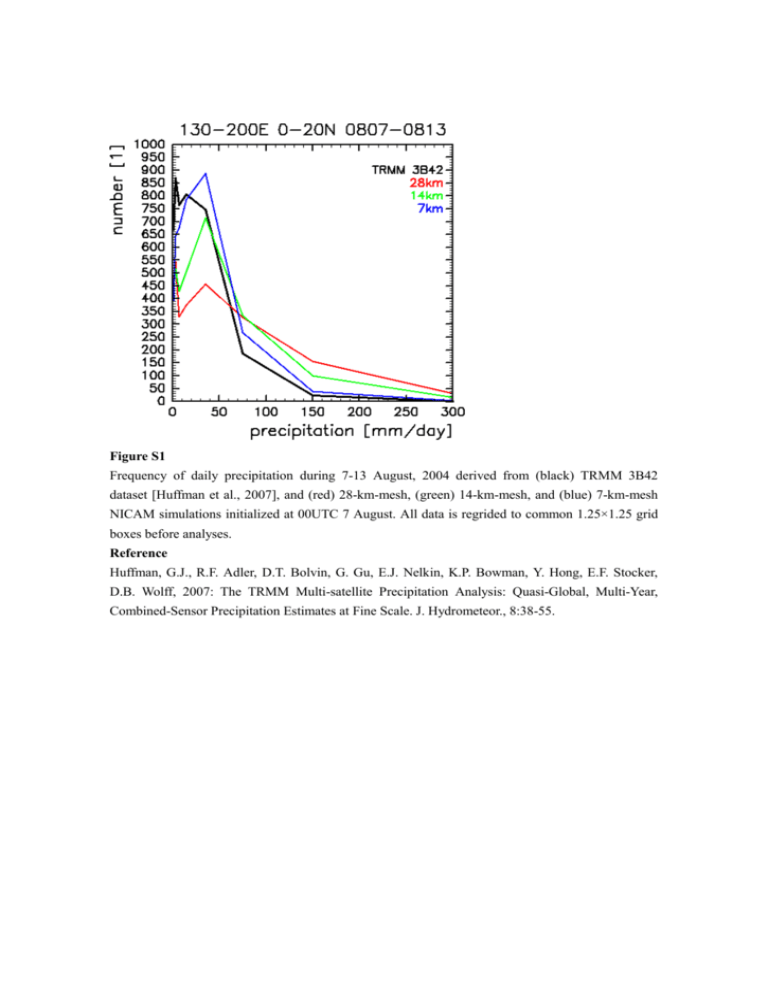
Figure S1 Frequency of daily precipitation during 7-13 August, 2004 derived from (black) TRMM 3B42 dataset [Huffman et al., 2007], and (red) 28-km-mesh, (green) 14-km-mesh, and (blue) 7-km-mesh NICAM simulations initialized at 00UTC 7 August. All data is regrided to common 1.25×1.25 grid boxes before analyses. Reference Huffman, G.J., R.F. Adler, D.T. Bolvin, G. Gu, E.J. Nelkin, K.P. Bowman, Y. Hong, E.F. Stocker, D.B. Wolff, 2007: The TRMM Multi-satellite Precipitation Analysis: Quasi-Global, Multi-Year, Combined-Sensor Precipitation Estimates at Fine Scale. J. Hydrometeor., 8:38-55. Figure S2 Hovmöller diagrams of observed (black contour in each panel) and simulated (color) OLR averaged between 120°E and 150°E. Observed OLR (200 W m−2) is derived from NOAA interpolated OLR. The abscissa shows days from 1 August onwards. The initial date of the simulation (mmdd) is shown in the upper left corner of each panel. Figure S3 Observed (a) and ensemble mean of 10-day mean OLR (green contour) and zonal wind at 850 hPa (color shading) averaged during 21-30 August 2004. NICAM simulations are initialized from 12 hrough 18 August using 14 km (b), 28 km (c), 56 km (d), 110 km (e), and 220km (f) horizontal resolutions without convective parameterization. Black cross in (a) indicate the location of Songda’s genesis. OLR values less than 200 W m-2 are shown with contour intervals of 20 W m-2. Broken lines depict the shear line.
