Create Reversal Design Graph in Excel - Tutorial
advertisement

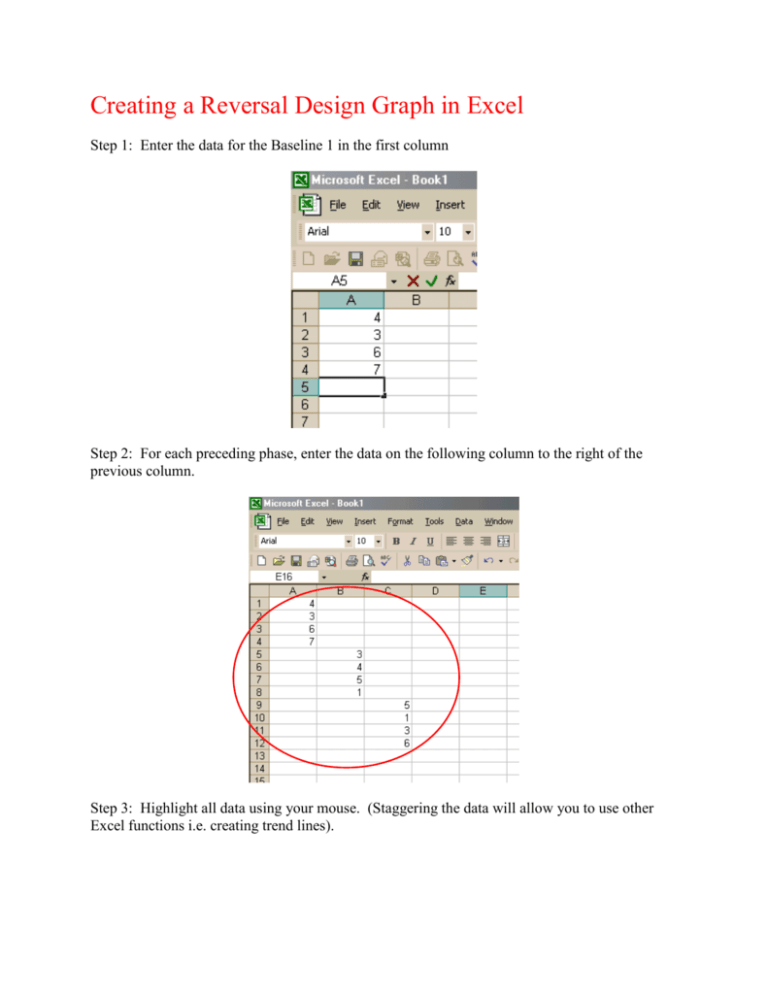
Creating a Reversal Design Graph in Excel Step 1: Enter the data for the Baseline 1 in the first column Step 2: For each preceding phase, enter the data on the following column to the right of the previous column. Step 3: Highlight all data using your mouse. (Staggering the data will allow you to use other Excel functions i.e. creating trend lines). Step 4: Click on the chart wizard button , the chart wizard box will appear. Choose Chart Type: Line from the Standard Types tab. Step 5: Once you have chosen your graph type hit the next button that will take you to next step in the chart wizard. You have already highlighted your data area so continue by hitting the next button again, which will take you to the last step in the chart wizard. Step 6: This last step you can just click on the finish button since chart wizard automatically chooses to insert your graph into your active sheet with your data. Step 7: You have just inserted data, and created a reversal design line graph in excel.


