RATIO ANALYSIS Contd
advertisement
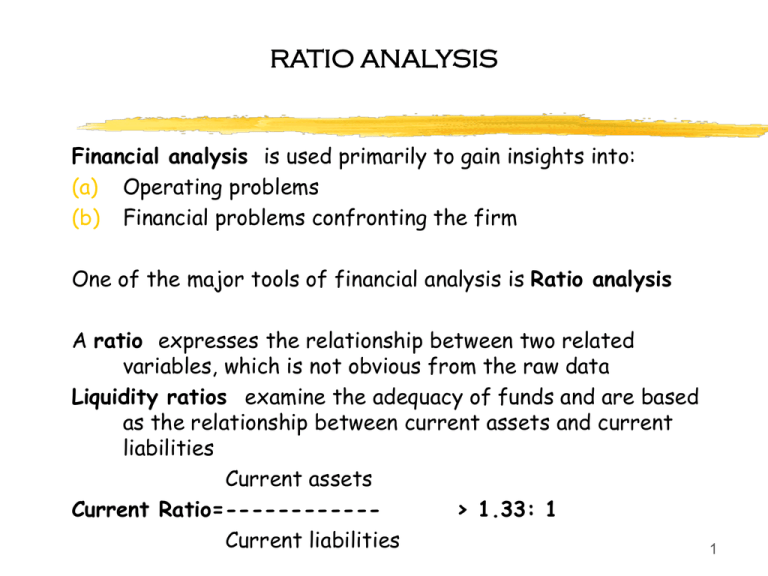
RATIO ANALYSIS Financial analysis is used primarily to gain insights into: (a) Operating problems (b) Financial problems confronting the firm One of the major tools of financial analysis is Ratio analysis A ratio expresses the relationship between two related variables, which is not obvious from the raw data Liquidity ratios examine the adequacy of funds and are based as the relationship between current assets and current liabilities Current assets Current Ratio=-----------> 1.33: 1 Current liabilities 1 RATIO ANALYSIS Contd…. A low ratio may indicate that a firm may not be able to pay its obligations on time. A high ratio may possibly a failure to properly utilise the firm’s resources. Current assets – Inventories Acid Test ratio = ---------------------------------Current liabilities – Bank borrowings This ratio concentrates on the immediately arising liabilities and the highly liquid assets that will be used to meet these obligations A high quick ratio indicates that cash and / or receivables are excessive, both possible signs of lax management A low quick ratio indicates the possibility of difficulties in prompt payment of bills in the near future. 2 RATIO ANALYSIS Contd Sales Account receivables Turnover = ----------------------Accounts Receivables A high ratio indicates a strict credit policy and aggressive collection procedures. A lower ratio indicates a large quantity of receivables and that perhaps the firm is experiencing difficulties in collecting its unpaid bills. Accounts Receivables Average Collection period = ---------------------------- x 365 Sales This ratio indicates how many days it took to accumulate the account receivables. 3 RATIO ANALYSIS Contd ROFITABILITY RATIOS : Operating Profit(EBIT) Profit margin ratio = -------------------------Sales This ratio indicates the overall operational efficiency of the firm to withstand adverse conditions, which may arise from several sources such as, falling prices, rising costs, and declining sales. Goss Profit Gross profit margin ratio = ----------------Sales (Gross profit = Sales – cost of Sales) It indicates the relation between production costs and selling price. 4 RATIO ANALYSIS Contd Sales Asset turn over Ratio = -------------Total Assets High ratio indicates, Increasing profits Operating profit (EBIT) Return on Investment = ---------------------------Assets A high ratio indicates efficient use of the assets and management’s skill Leverage Ratios: These are also called capital structure ratios, indicate the long-term financial position of the firm and the relative position of debt and equity in the financial structure of the firm 5 RATIO ANALYSIS Contd Debt Equity Ratio: Two version of the ratio are: Term Liabilities Total outside liabilities Debt Equity Ratio =(i) ------------------ (ii)------------------------Tangible Net worth Tangible Net worth Should be 3:1 upto 10 lakh & 2:1 above 10 lakh Total outside liabilities Debt Assets Ratio = ---------------------------------Total Assets A high ratio represents a great risk to creditors. A low ratio represents security to creditors. 6 RATIO ANALYSIS Contd Coverage Ratios indicate the relationship between debt servicing commitments and the sources for meeting task burdens Operating income (EBIT) Interest coverage Ratio=----------------------------Debt interest This ratio measures the margin of safety between the earning of the firm and its interest liability. A high ratio means the firm can easily meet its interest burden . A low ratio may result in financial embarrassment, when earnings decline 7 RATIO ANALYSIS Contd Cash flow coverage ratio: This ratio is a wider measure of the debt servicing ability as it considers both the interest and the principal repayment obligations Cash flow coverage ratio = = Earning before Interest & tax + Depreciation Debt interest + Repayment of loan 1 - Tax rate The ratio can be calculated including other fixed changes like base payments and preference dividend. 8 RATIO ANALYSIS Production costs High/ Low Assets How many Idle ? affect Contd…… Sales Adequate Interest is it excessive affect explains Selling price Asset Turnover Gross Profit Margin explains explains Profit Margin Return on explains Investment Return of Equity explains Earning Power 9 RATIO ANALYSIS Contd…. Measures ability of Management to earn: Return on Investment – a return on resources Return on equity - to cover operating profits to after tax returns for shareholder Earning power - to achieve an after tax return on resources. Uses and limitations of Ratio Analysis: These ratios might help in answering the following questions: a) Is the firm in a position to meet its current obligations ? b) What sources of long-term fund do the firm and what is the relationship between them ? c) Is there any danger to the solvency of the firm due to excessive-debt ? d) How effectively does the firm adequate ? e) Are the earnings of the firm adequate ? f) Do the investors consider the firm profitable enough, for the purpose of investing in the share of the firm ? 10 RATIO ANALYSIS Contd…. COMMON WINDOW DRESSING PRACTICES Balance sheet: i) Date of Balance sheet coinciding with end of season ii) Indicating Current expenses as Capital in Balance Sheet iii) Capitalisation of interest on term loans – leading to equated annual liability iv) Preparing Balance sheet on different dates for associate concerns.(lead to manipulation of accounts by paper entries-leads to non-detection of interlocking of funds / stocks) v) Temporary reduction in CL ( for a day or so). Setting off current liabilities against Current Assets. Issuing cheques in payment of current liabilities but not dispatching them( decrease in sundry creditors) vi) Maximising collection of receivables on balance sheet date thus showing a large cash balance ( including cheques yet to be realised) 11 RATIO ANALYSIS Contd…. vii) Withdrawal of intercorporate investments on Balance sheet date viii) Delaying declaration of commencement of production ix) Revaluation of fixed assts-leading to inflating the fixed assets value and improvement in Net worth position Profit & Loss Account: i) Restoring to heavy billing of sales on date of Balance sheet – leading to increase in sales, decrease in closing inventory and increases in profit ii) Changing the method of valuation of stocks iii) Changing the method of Depreciation – particularly with retrospective effect iv) Booking unrealised income (e.g. Export incentives) as revenue 12


