North American Fleet Overview
advertisement
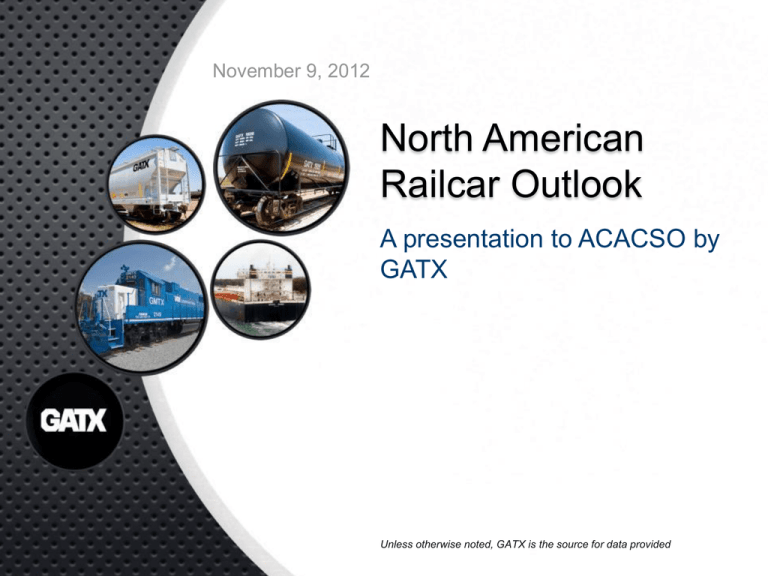
November 9, 2012 North American Railcar Outlook A presentation to ACACSO by GATX Unless otherwise noted, GATX is the source for data provided NYSE: GMT Forward-Looking Statements This document contains statements that may constitute forward-looking statements within the meaning of Section 27A of the Securities Act of 1933 and Section 21E of the Securities Exchange Act of 1934 and are subject to the safe harbor provisions of those sections and the Private Securities Litigation Reform Act of 1995. Some of these statements may be identified by words like “anticipate,” “believe,” “estimate,” “expect,” “intend,” “plan,” “predict,” “project” or other similar words. Investors are cautioned that any such forward-looking statements are not guarantees of future performance and involve risks and uncertainties, including those described in GATX’s Annual Report on Form 10-K for the year ended December 31, 2011 and other filings with the SEC, and that actual results or developments may differ materially from those in the forward-looking statements. Specific factors that might cause actual results to differ from expectations include, but are not limited to, (1) general economic, market, regulatory and political conditions affecting the rail, marine and other industries served by GATX and its customers; (2) competitive factors in GATX’s primary markets, including lease pricing and asset availability; (3) lease rates, utilization levels and operating costs in GATX’s primary operating segments; (4) conditions in the capital markets or changes in GATX’s credit ratings and financing costs; (5) risks related to compliance with, or changes to, laws, rules and regulations applicable to GATX and its rail, marine and other assets; (6) costs associated with maintenance initiatives; (7) operational and financial risks associated with long-term railcar purchase commitments; (8) changes in loss provision levels within GATX’s portfolio; (9) conditions affecting certain assets, customers or regions where GATX has a large investment; (10) impaired asset charges that may result from changing market conditions or portfolio management decisions implemented by GATX; (11) opportunities for remarketing income; (12) labor relations with unions representing GATX employees; and (13) the outcome of pending or threatened litigation. Given these risks and uncertainties, readers are cautioned not to place undue reliance on these forward-looking statements, which reflect management’s analysis, judgment, belief or expectation only as of the date hereof. GATX has based these forward-looking statements on information currently available and disclaims any intention or obligation to update or revise these forward-looking statements to reflect subsequent events or circumstances. 2 GATX Corporation • Founded in 1898 • Listed on NYSE in 1916 • Paid quarterly dividends since 1919 without interruption • One of the largest rail rolling stock lessors in the world 3 Today’s Discussion Objective • Provide useful, actionable information about the North American fleet to railcar users and other stakeholders Agenda • Fleet composition (since Jan-’08) • Ownership trends (since Jan-’08) • Current market conditions 4 North American Fleet Composition by Owner Type 5 Source: UMLER as of 1/1/12 Change in Fleet Composition 1/1/08-1/1/12 Car Type Change (000) Change (%) Tank Intermodal Non-Intermodal Flat Open-Top Hopper and Gondola +4 -1 -9 -22 +1% -1% -6% -5% Covered Hopper Box -24 -51 -5% -26% 6 Source: UMLER as of 1/1/12 Bulk Railcar Gross Rail Load 1/1/08-1/1/12 Railcar Type Covered Hopper Open-Top Hopper and Gondola Tank Average GRL 1/1/08 273.6 Average GRL 1/1/12 276.1 Change 275.4 277.0 +0.6% 264.9 265.7 +0.3% +0.9% 7 Source: UMLER as of 1/1/12 Ownership & Trend 1/1/08-1/1/12 TTX, 9% Fleet Makeup at 1/1/12 Shipper, 19% Lessor, 48% Railroad, 24% Owner Type Change (000) Change (%) Lessor TTX +25 -5 +3% -4% Shipper Railroad -38 -85 -11% -18% 8 Source: UMLER as of 1/1/12 Carloads (MM) Fleet Size (000s) Total Carloads vs. Fleet Size 1/1/08-1/1/12 9 Source: UMLER and RSI Total Rail Industry Railcar Manufacturing Backlog 10 Source: ARCI Total Builds vs. Attrition 11 Source: UMLER, ARCI What Are The Headlines Driving Fleet Performance? • Good o Fracking • Bakken crude • NGLs • Plastics and chemicals recovery o Auto recovery • Bad o Drought o Coal car oversupply • Mixed o Railroad velocity 12 Tank Car Fleet Size vs. Chemical and Petroleum Carloads 13 Source: UMLER and AAR A Strong Tank Car Market • Tank car backlogs at all builders extend into 2014 • ARCI tank car backlog at ~42,370 • FTR forecasts record or near-record production through 2014 • Crude as driver • YTD Petroleum Product carloadings are up >35% vs. similar point in 2011 14 New Car Production vs. Attrition 25,000 20,000 15,000 10,000 5,000 New Large Pressure Tankcars New Large General Service Tankcars All Other New Tankcars Tankcar Attrition 2008 2009 2010 2011 2012F2013F Over 6 years: • Large GS tanks will be 48% of build vs. 18-25% of fleet • Large pressure cars will be 14% of build vs. 13% of fleet • Remaining fleet will shrink by 2% due to “crowding out” by shalerelated cars Sources: UMLER, ARCI, FTR, GATX business partners 15 North American Tank Car Fleet Size Sources: UMLER, ARCI, FTR, GATX business partners 16 Coal Cars Facing Multiple Near-Term Headwinds • YTD coal carloadings are down 8.6% vs. similar point in 2011, and down 17.3% compared to this point in 2008 • Railroad velocity up ~2MPH YOY • NA coal production down ~10% versus recent peak • Aggressive environmental regulation compelling plant closures due to retrofit costs • Natural gas trading at or near historic lows • Recent moderate weather patterns have reduced burn and increased stockpiles Sources: Argus, EIA 17 Medium-Cube Open-Top Fleet Size vs. Coal Carloads 18 Source: UMLER and AAR Distribution of Coal Fleet Fleet Size 22,000 67,751 90,673 96,376 Railroad Shipper Lessor Active Lessor Idle • Lessors as Marginal Capacity • Sources of Utilization Improvement • Attrition • Velocity • Weather • Gas Prices Source for idle car estimate: GATX customers and business partners 19 Conclusions for Tank Cars • Tank car supply should remain tight for the near term, so users should value and prioritize it over other concerns • Ethanol is the market to watch • Regulatory developments must be monitored • Recent spike in ownership will abate, as complexity around regulations and maintenance, plus variable demand, will push users back to leasing 20 Conclusions for Freight Cars • Outside of a few markets (e.g. automotive), freight cars are either in balance or oversupplied • Broad, near-term carload growth is unlikely, though retirements will keep most freight car markets balanced • For now, freight car users can manage costs with less concern for availability, but improved economic conditions and/or normal weather patterns could shift the balance back to lessors o Grain – impact of robust harvest? o Coal – impact of cold winter and/or rising gas prices? • Railroad velocity could tip the supply/demand balance 21 Recap Provide useful, actionable information about the North American fleet to railcar users and other stakeholders • Fleet composition (since Jan-’08) • Ownership trends (since Jan-’08) • Current market conditions Questions? Robert J. Gordon Director, Fleet Administration GATX Corporation (312) 621-6375 robert.gordon@gatx.com
