HONDA MOTOR (ADR)
TIMELINESS
SAFETY
TECHNICAL
4
3
5
High:
Low:
Lowered 11/20/15
RECENT
PRICE
NYSE-HMC
29.7
23.8
39.9
27.1
40.8
31.3
36.4
17.3
17.0 RELATIVE
DIV’D
Median: 14.0) P/E RATIO 0.74 YLD 2.8%
29.22 P/ERATIO 13.9(Trailing:
34.5
20.3
39.7
28.3
44.6
27.5
39.3
28.5
43.0
35.2
41.4
28.8
36.4
28.6
31.0
24.0
Target Price Range
2019 2020 2021
LEGENDS
6.0 x ″Cash Flow″p ADR
. . . . Relative Price Strength
Options: Yes
Shaded area indicates recession
Lowered 8/21/15
Lowered 8/19/16
BETA 1.05 (1.00 = Market)
VALUE
LINE
120
100
80
64
48
2019-21 PROJECTIONS
Ann’l Total
Price
Gain
Return
High
65 (+120%) 24%
Low
45 (+55%) 14%
Insider Decisions
32
24
20
16
12
NOT REPORTED
% TOT. RETURN 7/16
U.S. Institutional Decisions
3Q2015
99
to Buy
to Sell
111
Hld’s(000) 58153
4Q2015
100
113
57312
1Q2016
111
115
54248
Percent
shares
traded
3
2
1
1 yr.
3 yr.
5 yr.
2000 2001 2002 2003 2004 2005 2006 2007 2008 2009 2010 2011 2012 2013 2014 2015 2016 2017
124
133
120
106
107
118
118
26.77 28.41 34.09 40.49 43.55 45.82 51.53
1.67
2.15
2.77
3.36
3.58
3.97
4.48
.96
1.40
1.83
2.30
2.42
2.76
2.75
.09
.10
.13
.15
.23
.33
.66
1.18
1.17
1.36
1.43
1.88
2.13
2.78
9.24
9.93 11.25 14.26 16.56 19.08 20.83
1948.8 1948.8 1948.8 1907.3 1849.7 1840.8 1824.7
19.3
14.3
10.8
8.8
10.0
9.8
12.7
1.25
.73
.59
.50
.53
.52
.69
.5%
.5%
.7%
.8%
1.0%
1.2%
1.9%
CAPITAL STRUCTURE as of 3/31/16
94018
Total Debt $58696 mill. Due in 5 Yrs $15000 mill.
11.0%
LT Debt $33789 mill. LT Interest $165 mill.
3150.0
(LT int. earned and total int. coverage: over 25X)
(54% of Cap’l) 5023.0
35.8%
Pension Assets-3/16 $16.5 bill.
5.3%
Oblig. $20.5 bill.
Pfd Stock None
8182.0
16160
Common Stock 1,802,283,519 shares
38012
(equivalent to 1,802.3 mill. ADRs)
9.8%
13.2%
MARKET CAP: $52.7 billion (Large Cap)
CURRENT POSITION 2013
2014 3/31/16 10.7%
19%
($MILL.)
Cash Assets
Receivables
Inventory (FIFO)
Other
Current Assets
Accts Payable
Debt Due
Other
Current Liab.
ANNUAL RATES
of change (per ADR)
Sales
‘‘Cash Flow’’
Earnings
Dividends
Book Value
Fiscal
Year
Begins
2013
2014
2015
2016
2017
Fiscal
Year
Begins
2013
2014
2015
2016
2017
Calendar
2012
2013
2014
2015
2016
11371
25514
12674
6582
56141
10420
25513
9897
45830
Past
10 Yrs.
4.5%
6.5%
1.5%
16.5%
8.5%
12221
23807
12384
6687
55099
9759
10889
23423
44071
15659
24578
11726
3766
55729
10072
24907
13863
48842
Past Est’d ’13-’15
5 Yrs.
to ’19-’21
1.0%
6.0%
3.0%
6.5%
6.0%
6.0%
5.0%
5.0%
5.5%
6.0%
QUARTERLY SALES ($ mill.) B
Jun.30 Sep.30 Dec.31 Mar.31
27507 28052 29321 30062
26234 26466 28882 29441
32960 32217 32182 32543
34103 33000 33500 33022
34000 35500 35000 36415
EARNINGS PER ADR BC
Jun.30 Sep.30 Dec.31 Mar.31
.66
.65
.87
.92
.66
.64
.61
.44
.92
.63
.61
d.46
.94
.40
.40
.36
.65
.55
.55
.60
GROSS QUARTERLY DIV’DS PAID D
Mar.31 Jun.30 Sep.30 Dec.31
.185
.186
.242
.231
.206
.194
.203
.195
.196
.216
.211
.185
.184
.179
.183
.178
.193
.211
Full
Fiscal
Year
114942
111023
129902
133625
140915
Full
Fiscal
Year
(A) At fiscal yearend. (B) Fiscal year ends
March 31 of following year. Current year figures and estimates based on most recent
quarter-end exchange rate. (C) Diluted earn-
3.10
2.35
1.70
2.10
2.35
Full
Year
.84
.80
.81
.72
100
65.99
6.15
3.30
.76
3.60
24.98
1815.4
10.1
.54
2.3%
119801
12.3%
5174.0
5989.0
43.3%
5.0%
5520.0
18332
45356
10.3%
13.2%
9.8%
25%
98.23 93.04 83.19 82.03 94.16
56.16 50.82 59.61 53.66 58.21
4.35
5.32
7.82
5.01
5.64
.77
1.59
3.55
1.49
2.16
.75
.37
.65
.76
.87
3.56
2.32
2.12
2.68
3.69
22.48 25.64 29.68 29.72 29.68
1814.6 1814.6 1802.3 1802.3 1802.3
35.8
19.8
10.0
23.1
15.8
2.15
1.32
.64
1.45
1.01
2.7%
1.2%
1.8%
2.2%
2.6%
101916 92210 107430 96704 104906
8.3% 11.6% 13.5%
9.6% 11.5%
6491.0 6768.0 7665.1 6458.0 6270.8
1395.0 2885.0 6420.3 2573.0 3899.1
67.9% 43.7% 32.8% 52.7% 36.6%
1.4%
3.1%
6.0%
2.7%
3.7%
3907.0 12840 13486 14105 6822.3
19675 24861 24562 27193 23736
40795 46525 53493 53565 53498
2.7%
4.2%
8.2%
3.2%
5.1%
3.4%
6.2% 12.0%
4.8%
7.3%
NMF
4.8%
9.9%
2.0%
4.7%
102%
23%
17%
59%
35%
THIS
STOCK
VL ARITH.*
INDEX
-20.1
-26.6
-31.5
4.8
25.2
69.0
© VALUE LINE PUB. LLC
103
120
112 102.9 102.9 Translation Rate (Yen/$)A
63.78 61.60 72.00 74.00 78.00 Sales per ADR B
5.48
6.76
7.75
8.30 ‘‘Cash Flow’’ per ADR
7.37
2.35
1.70
2.10
2.35 Earnings per ADR BC
3.10
.76
.71
.82
.90 Gross Div’ds Decl’d/ADR
.77
3.00
3.00
3.00
4.00 Cap’l Spending per ADR
4.17
31.88 34.12 36.31 40.95 42.40 Book Value per ADR
1802.3 1802.3 1802.3 1802.3 1802.3 Equiv ADRs Outst’g E
14.0
18.5 Bold figures are Avg Ann’l P/E Ratio
12.5
Value Line
.74
.93
Relative P/E Ratio
.70
estimates
2.3%
2.3%
Avg Ann’l Div’d Yield
2.0%
114942 111023 129902 133625 140915 Sales ($mill) B
9.7%
9.9% 11.5% 11.5% Operating Margin
13.0%
7713.5 5208.2 9119.2 10200 10700 Depreciation ($mill)
3785
4245 Net Profit ($mill)
5572.2 4673.9 3063.6
34.7% 30.4% 36.5% 36.5% 36.0% Income Tax Rate
4.2%
2.4%
2.8%
3.0% Net Profit Margin
4.8%
6725
9600 Working Cap’l ($mill)
10311 11028 6887.0
31390 32706 34697 34975 34500 Long-Term Debt ($mill)
57449 61499 65433 73775 76400 Shr. Equity ($mill)
5.0%
3.0%
3.5%
4.0% Return on Total Capital
6.3%
7.6%
4.5%
5.0%
5.5% Return on Shr. Equity
9.7%
5.5%
2.5%
3.0%
3.5% Retained to Com Eq
7.1%
28%
45%
39%
38% All Div’ds to Net Prof
26%
8
19-21
102.9
92.00
10.20
3.45
D 1.10
4.00
45.50
1802.3
16.0
1.00
2.0%
165450
12.5%
12150
6225
37.0%
3.8%
14575
33400
87450
5.5%
7.0%
5.0%
32%
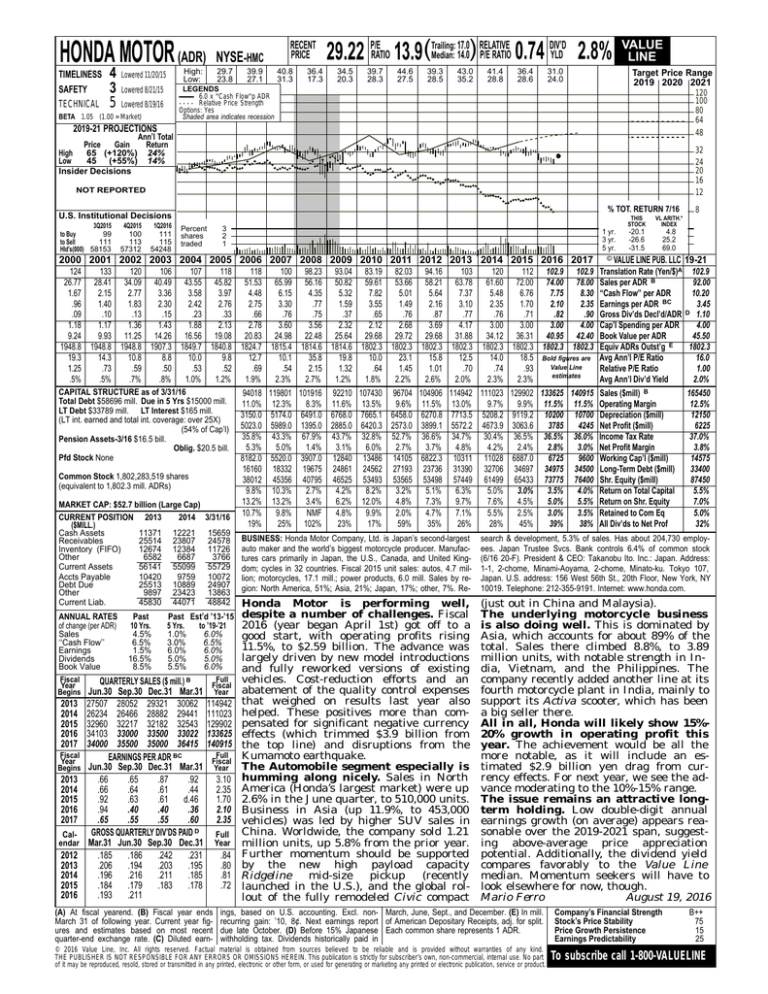
BUSINESS: Honda Motor Company, Ltd. is Japan’s second-largest
auto maker and the world’s biggest motorcycle producer. Manufactures cars primarily in Japan, the U.S., Canada, and United Kingdom; cycles in 32 countries. Fiscal 2015 unit sales: autos, 4.7 million; motorcycles, 17.1 mill.; power products, 6.0 mill. Sales by region: North America, 51%; Asia, 21%; Japan, 17%; other, 7%. Re-
search & development, 5.3% of sales. Has about 204,730 employees. Japan Trustee Svcs. Bank controls 6.4% of common stock
(6/16 20-F). President & CEO: Takanobu Ito. Inc.: Japan. Address:
1-1, 2-chome, Minami-Aoyama, 2-chome, Minato-ku. Tokyo 107,
Japan. U.S. address: 156 West 56th St., 20th Floor, New York, NY
10019. Telephone: 212-355-9191. Internet: www.honda.com.
Honda Motor is performing well,
despite a number of challenges. Fiscal
2016 (year began April 1st) got off to a
good start, with operating profits rising
11.5%, to $2.59 billion. The advance was
largely driven by new model introductions
and fully reworked versions of existing
vehicles. Cost-reduction efforts and an
abatement of the quality control expenses
that weighed on results last year also
helped. These positives more than compensated for significant negative currency
effects (which trimmed $3.9 billion from
the top line) and disruptions from the
Kumamoto earthquake.
The Automobile segment especially is
humming along nicely. Sales in North
America (Honda’s largest market) were up
2.6% in the June quarter, to 510,000 units.
Business in Asia (up 11.9%, to 453,000
vehicles) was led by higher SUV sales in
China. Worldwide, the company sold 1.21
million units, up 5.8% from the prior year.
Further momentum should be supported
by the new high payload capacity
Ridgeline
mid-size
pickup
(recently
launched in the U.S.), and the global rollout of the fully remodeled Civic compact
(just out in China and Malaysia).
The underlying motorcycle business
is also doing well. This is dominated by
Asia, which accounts for about 89% of the
total. Sales there climbed 8.8%, to 3.89
million units, with notable strength in India, Vietnam, and the Philippines. The
company recently added another line at its
fourth motorcycle plant in India, mainly to
support its Activa scooter, which has been
a big seller there.
All in all, Honda will likely show 15%20% growth in operating profit this
year. The achievement would be all the
more notable, as it will include an estimated $2.9 billion yen drag from currency effects. For next year, we see the advance moderating to the 10%-15% range.
The issue remains an attractive longterm holding. Low double-digit annual
earnings growth (on average) appears reasonable over the 2019-2021 span, suggesting above-average price appreciation
potential. Additionally, the dividend yield
compares favorably to the Value Line
median. Momentum seekers will have to
look elsewhere for now, though.
Mario Ferro
August 19, 2016
ings, based on U.S. accounting. Excl. non- March, June, Sept., and December. (E) In mill.
recurring gain: ’10, 8¢. Next earnings report of American Depositary Receipts, adj. for split.
due late October. (D) Before 15% Japanese Each common share represents 1 ADR.
withholding tax. Dividends historically paid in
© 2016 Value Line, Inc. All rights reserved. Factual material is obtained from sources believed to be reliable and is provided without warranties of any kind.
THE PUBLISHER IS NOT RESPONSIBLE FOR ANY ERRORS OR OMISSIONS HEREIN. This publication is strictly for subscriber’s own, non-commercial, internal use. No part
of it may be reproduced, resold, stored or transmitted in any printed, electronic or other form, or used for generating or marketing any printed or electronic publication, service or product.
Company’s Financial Strength
Stock’s Price Stability
Price Growth Persistence
Earnings Predictability
B++
75
15
25
To subscribe call 1-800-VALUELINE


