DO lab questions - local.brookings.k12.sd.us
advertisement
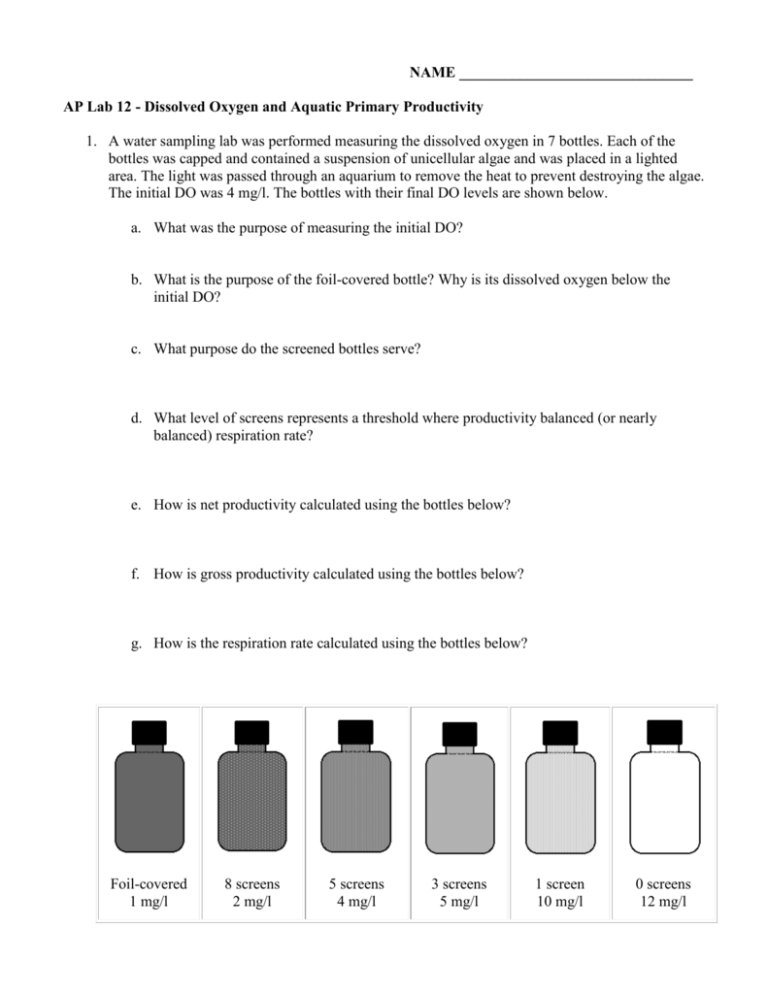
NAME _______________________________ AP Lab 12 - Dissolved Oxygen and Aquatic Primary Productivity 1. A water sampling lab was performed measuring the dissolved oxygen in 7 bottles. Each of the bottles was capped and contained a suspension of unicellular algae and was placed in a lighted area. The light was passed through an aquarium to remove the heat to prevent destroying the algae. The initial DO was 4 mg/l. The bottles with their final DO levels are shown below. a. What was the purpose of measuring the initial DO? b. What is the purpose of the foil-covered bottle? Why is its dissolved oxygen below the initial DO? c. What purpose do the screened bottles serve? d. What level of screens represents a threshold where productivity balanced (or nearly balanced) respiration rate? e. How is net productivity calculated using the bottles below? f. How is gross productivity calculated using the bottles below? g. How is the respiration rate calculated using the bottles below? Foil-covered 1 mg/l 8 screens 2 mg/l 5 screens 4 mg/l 3 screens 5 mg/l 1 screen 10 mg/l 0 screens 12 mg/l 2. The graph on the right represents data collected in productivity experiment of the same type of experiment that is depicted above. At what level of light percent is there no net productivity? At what light intensity is there no gross productivity? Explain. 3. The graph to the left describes the relationship between dissolved oxygen and temperature. Describe the relationship and explain it 4. Two cultures are prepared in the lab as follows: one has little phytoplankton but is high in zooplankton, and has a low DO to start. The other is rich in phytoplankton and zooplankton, and has a high dissolved oxygen to start. Bottle A Bottle B Phytoplankton low high Zooplankton high high Initial DO low high a. Describe what should happen in the two bottles after 40 minutes of light exposure in the lab. Explain your description. b. Which should have the highest net productivity? c. Which should have the highest gross productivity? d. Which should have the highest respiration rate? 5. A class of AP Biology students collected respiration rate data from BOD bottles using suspensions of unicellular freshwater algae. The class averages for the respiration found with the dark bottles is shown at the right. Class Mean Productivity Data # screens % light DO 0 100% 10.5 1 65% 8.9 3 25% 6.5 5 10% 5.9 8 2% 4.8 GP LB-DB NP LB-IB Respiration Rate Table Class Mean Initial DO 4.0 Dark Bottle DO 3.1 A table to the left summarizes the data collection of one lab group. a. Calculate the GP and NP for each bottle. b. Graph the data on the graph provided. c. What does the graph indicate about the productivity of the system in the bottles? 6. In the diagram to the right, two containers hold fish and no algae. Which will maintain a higher DO over a 24 hour period? Explain. 7. a. In an outdoor pond over a 24 hour period, when would the DO be the highest? b. When would it be the lowest? 8. Explain why fertilizer runoff into a pond and the resulting eutrophication is an ecological problem for aquatic life in the pond. 9. You must be able to use the nomogram below. If the water temperature is 25°C and saturated with oxygen, what is the concentration of the oxygen in the water? 10, If a student buys a bottled water that is 20% saturated with oxygen at 10°C, what happens to the oxygen saturation level as the bottle warms on his desk (without opening) before he drinks it? Modified from: http://www2.sluh.org/bioweb/apbio/labs/apl12.htm
