Kate PenrodFourier-Transform Infrared Spectroscopy, FT
advertisement
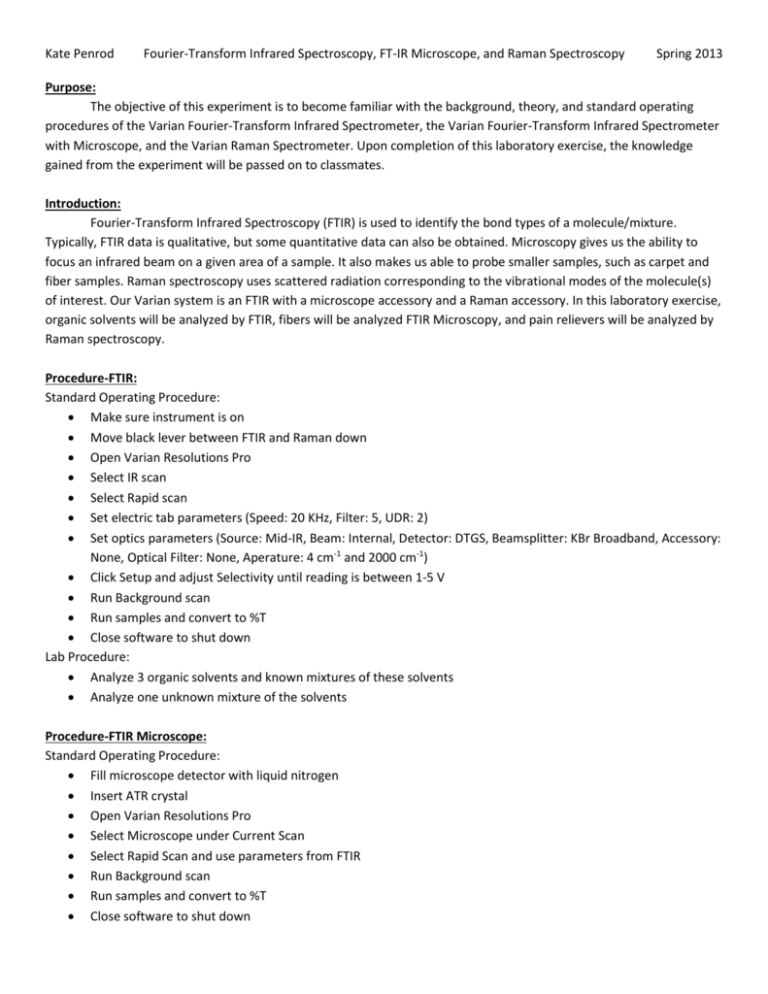
Kate Penrod Fourier-Transform Infrared Spectroscopy, FT-IR Microscope, and Raman Spectroscopy Spring 2013 Purpose: The objective of this experiment is to become familiar with the background, theory, and standard operating procedures of the Varian Fourier-Transform Infrared Spectrometer, the Varian Fourier-Transform Infrared Spectrometer with Microscope, and the Varian Raman Spectrometer. Upon completion of this laboratory exercise, the knowledge gained from the experiment will be passed on to classmates. Introduction: Fourier-Transform Infrared Spectroscopy (FTIR) is used to identify the bond types of a molecule/mixture. Typically, FTIR data is qualitative, but some quantitative data can also be obtained. Microscopy gives us the ability to focus an infrared beam on a given area of a sample. It also makes us able to probe smaller samples, such as carpet and fiber samples. Raman spectroscopy uses scattered radiation corresponding to the vibrational modes of the molecule(s) of interest. Our Varian system is an FTIR with a microscope accessory and a Raman accessory. In this laboratory exercise, organic solvents will be analyzed by FTIR, fibers will be analyzed FTIR Microscopy, and pain relievers will be analyzed by Raman spectroscopy. Procedure-FTIR: Standard Operating Procedure: Make sure instrument is on Move black lever between FTIR and Raman down Open Varian Resolutions Pro Select IR scan Select Rapid scan Set electric tab parameters (Speed: 20 KHz, Filter: 5, UDR: 2) Set optics parameters (Source: Mid-IR, Beam: Internal, Detector: DTGS, Beamsplitter: KBr Broadband, Accessory: None, Optical Filter: None, Aperature: 4 cm-1 and 2000 cm-1) Click Setup and adjust Selectivity until reading is between 1-5 V Run Background scan Run samples and convert to %T Close software to shut down Lab Procedure: Analyze 3 organic solvents and known mixtures of these solvents Analyze one unknown mixture of the solvents Procedure-FTIR Microscope: Standard Operating Procedure: Fill microscope detector with liquid nitrogen Insert ATR crystal Open Varian Resolutions Pro Select Microscope under Current Scan Select Rapid Scan and use parameters from FTIR Run Background scan Run samples and convert to %T Close software to shut down Kate Penrod Fourier-Transform Infrared Spectroscopy, FT-IR Microscope, and Raman Spectroscopy Spring 2013 Lab Procedure: Analyze known fibers Analyze one unknown fiber Procedure-Raman: Standard Operating Procedure: Fill the Raman dewar with liquid nitrogen Wait 20 minutes Make sure FTIR is on Wait 10 minutes and top off the dewar Turn on power supply to laser (press switch and turn key) Ensure that levers on either side of the Raman are switched on Ensure that the lever inside the Raman is up with bypass closed Prepare sample in capillary tube with a depth of about 1 inch Prepare solids in 4 inch NMR tube Be sure to use the correct holder for the correct tube Center the sample on the red holographic dot by adjusting the x, y, and z knobs Open Varian Resolutions Pro Select Raman Scan (IR Source: Off, Beam: Right, Detector: Raman ge, Beamsplitter: Quartz Near IR, ATR Crystal: None, Optical Filter: Holographic Notch, Aperature: Open) Select Laser tab and turn on diode Press shutter switch in front of Raman Set Raman power to the highest setting Adjust value of laser control current to 600-700 mW Click setup and adjust centerburst to its maximum (use x,y, and z knobs) Click Scan Repeat for all samples Turn off laser, close shutter, remove sample, turn off laser key and switch Leave instrument on Lab Procedure: Analyze known painkillers Analyze one unknown painkiller Data: FTIR data from Day 1 can be found on page 71 of Instrumental Notebook FTIR Microscope data from Day 2 can be found on page 74 of Instrumental Notebook No Raman data were collected due to errors with the instrument Kate Penrod Fourier-Transform Infrared Spectroscopy, FT-IR Microscope, and Raman Spectroscopy Representative FTIR Data: % Toluene % 2-Propanol % 2-Butanone Toluene 1 (%T) Toluene 2 (%T) 100 0 0 25 25 50 33 55.80993568 0 0 100 50 25 25 33 42.44863388 40.111 n/a n/a 74.956 73.473 59.428 65.393 59.525 9.5458 n/a n/a 48.981 46.638 28.032 35.91 29.873 0 100 0 25 50 25 33 7.072249589 2-Propanol (%T) n/a 20.246 n/a 68.76 44.002 63.664 58.589 75.143 Spring 2013 2-Butanone (%T) n/a n/a 0.054294 4.1811 14.052 18.065 3.9065 8.8219 Calibration Curve for FTIR Data: 80 Calibration Curves for Toluene, 2-Propanol, 2-Butanone Mixtures (FTIR) 70 % Transmittance (%) 60 y = -0.4399x + 83.173 R² = 0.9698 y = -0.5102x + 59.33 R² = 0.9558 50 Toluene 1 Toluene 2 2-Propanol 40 2-Butanone y = -0.6095x + 79.454 R² = 0.9677 30 Linear (Toluene 1) Linear (Toluene 2) Linear (2-Propanol) Linear (2-Butanone) 20 y = -0.1833x + 16.593 R² = 0.5756 10 0 0 20 40 60 Mass Percent (%) 80 100 120 Kate Penrod Fourier-Transform Infrared Spectroscopy, FT-IR Microscope, and Raman Spectroscopy Calculations for FTIR: Toluene 1: y=-0.439x+83.17 y=59.525 x=53.86104784 2-Propanol: y=-0.609x+79.45 y=75.143 x=7.072249589 Toluene 2: y=-0.510x+59.33 y=29.873 x=57.75882353 2-Butanone: y=-0.183+16.59 y=8.8219 x=42.448633 Spring 2013 Discussion and Conclusion: Infrared spectroscopy is very useful for qualitative data, but it is difficult to generate quantitative data from FTIR. The calibration curves generates from the FTIR data in this laboratory exercise were not of high quality. The 2butanone curve had an R2 value of 0.575, which is analytically unacceptable. The other calibration curves were better, but the quality was still less than stellar. Using these calibration curves, we were able to determine that the relative percentages of the components in the unknown were 56% toluene, 7% 2-propanol, and 42% 2-butanone. This does not sum to 100%, so it is evident that the percentages are inexact, but the data generated is still useful. It is likely that the relative order (primarily toluene, followed by 2-butanone, very low concentration of 2-propanol) of the concentrations is correct, although the numbers may not be entirely representative of the sample. The microscopy portion of this experiment was interesting, though did not yield entirely useful data. The library indicated that all samples matched all library entries, indicating that our spectra were of low quality. The images obtained (page 74 in Instrumental Notebook) were clear and the weave patterns were visible. Unknown B was tentatively identified as an acrylic/wool mixture, but this identification is inconclusive because wool was not analyzed as a standard, nor was an acrylic/wool mixture. The unknown spectrum did not conclusively match any of our standard spectra, so identification cannot be performed with any degree of analytical certainty. The Raman was not functional during this experiment, but it was useful to learn that SpectroPhysics is not very helpful in troubleshooting instruments, as our Raman accessory has been down for approximately 90% of the semester. Overall, the FTIR is a user-friendly instrument, but it is important to obtain clean spectra. Our spectra were not of highest quality, and this experiment could have been improved significantly if we had waited until consistent spectra were obtained before analyzing the results. This experiment also could have been improved by analyzing more standards for the microscopy portion.
