Financial Statement Analysis Exercises

Module 1 Class Exercises
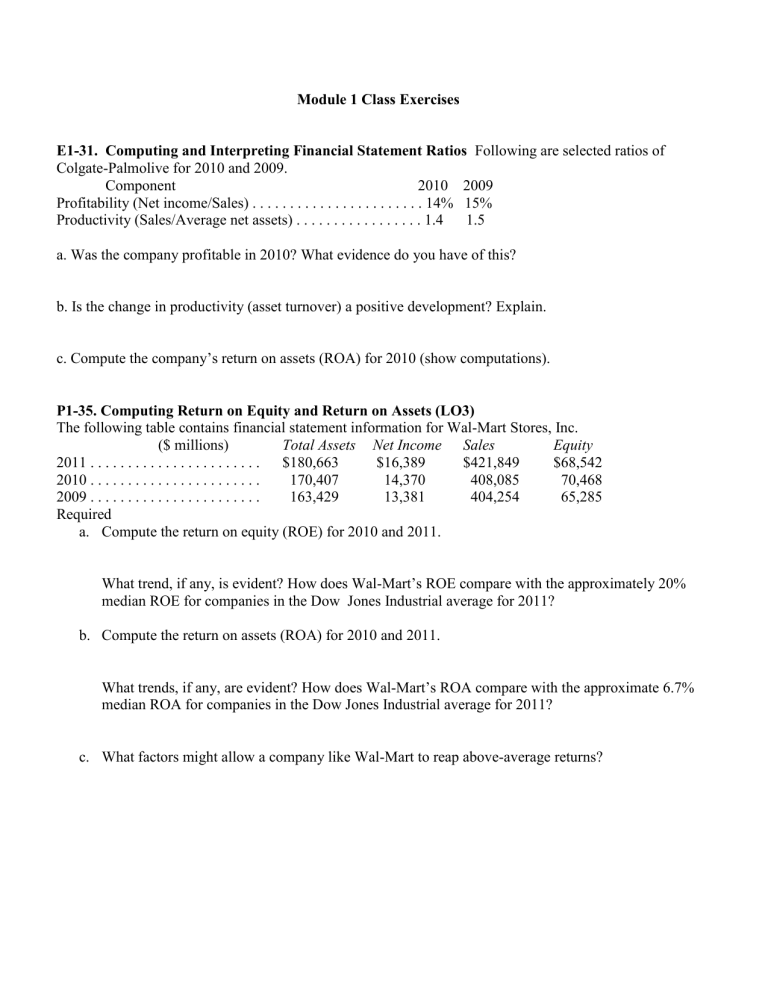
E1-31. Computing and Interpreting Financial Statement Ratios Following are selected ratios of
Colgate-Palmolive for 2010 and 2009.
Component 2010 2009
Profitability (Net income/Sales) . . . . . . . . . . . . . . . . . . . . . . . 14% 15%
Productivity (Sales/Average net assets) . . . . . . . . . . . . . . . . . 1.4 1.5 a. Was the company profitable in 2010? What evidence do you have of this? b. Is the change in productivity (asset turnover) a positive development? Explain. c. Compute the company’s return on assets (ROA) for 2010 (show computations).
P1-35. Computing Return on Equity and Return on Assets (LO3)
The following table contains financial statement information for Wal-Mart Stores, Inc.
($ millions) Total Assets Net Income Sales Equity
2011 . . . . . . . . . . . . . . . . . . . . . . . $180,663 $16,389
2010 . . . . . . . . . . . . . . . . . . . . . . . 170,407 14,370
2009 . . . . . . . . . . . . . . . . . . . . . . . 163,429 13,381
Required a.
Compute the return on equity (ROE) for 2010 and 2011.
$421,849
408,085
404,254
$68,542
70,468
65,285
What trend, if any, is evident? How does Wal-Mart’s ROE compare with the approximately 20% median ROE for companies in the Dow Jones Industrial average for 2011? b.
Compute the return on assets (ROA) for 2010 and 2011.
What trends, if any, are evident? How does Wal-Mart’s ROA compare with the approximate 6.7% median ROA for companies in the Dow Jones Industrial average for 2011? c.
What factors might allow a company like Wal-Mart to reap above-average returns?
P1-36. Formulating Financial Statements from Raw Data Following is selected financial information from General Mills, Inc., for its fiscal year ended May 29, 2011 ($ millions).
Revenue . . . . . . . . . . . . . . . . . . . . . . . . . . . . . . . . . . . . . . . . . . . . $14,880.2
Cash from operating activities . . . . . . . . . . . . . . . . . . . . . . . . . . . 1,526.8
Cash, beginning year . . . . . . . . . . . . . . . . . . . . . . . . . . . . . . . . . . 673.2
Stockholders’ equity . . . . . . . . . . . . . . . . . . . . . . . . . . . . . . . . . . 6,612.2
Noncash assets . . . . . . . . . . . . . . . . . . . . . . . . . . . . . . . . . . . . . . 18,054.9
Cash from financing activities*. . . . . . . . . . . . . . . . . . . . . . . . . . . (865.3)
Cost of goods sold. . . . . . . . . . . . . . . . . . . . . . . . . . . . . . . . . . . . 8,926.7
Total expenses (other than cost of goods sold) . . . . . . . . . . . . . . 4,155.2
Cash, ending year . . . . . . . . . . . . . . . . . . . . . . . . . . . . . . . . . . . . 619.6
Total liabilities . . . . . . . . . . . . . . . . . . . . . . . . . . . . . . . . . . . . . . . . 12,062.3
Cash from investing activities. . . . . . . . . . . . . . . . . . . . . . . . . . . . (715.1)
* Cash from financing activities includes the effects of foreign exchange rate fluctuations.
Required a. Prepare
Income statement
Balance sheet
Statement of cash flows b. Do the negative amounts for cash from investing activities and cash from financing activities concern us? Explain. c. Using the statements prepared for part a, compute the following ratios (for this part only, use the yearend balance instead of the average for assets and stockholders’ equity): i. Profit margin ii. Asset turnover iii. Return on assets iv. Return on equity


