Mitosis Lab: Onion Root Tip Cell Cycle Analysis
advertisement
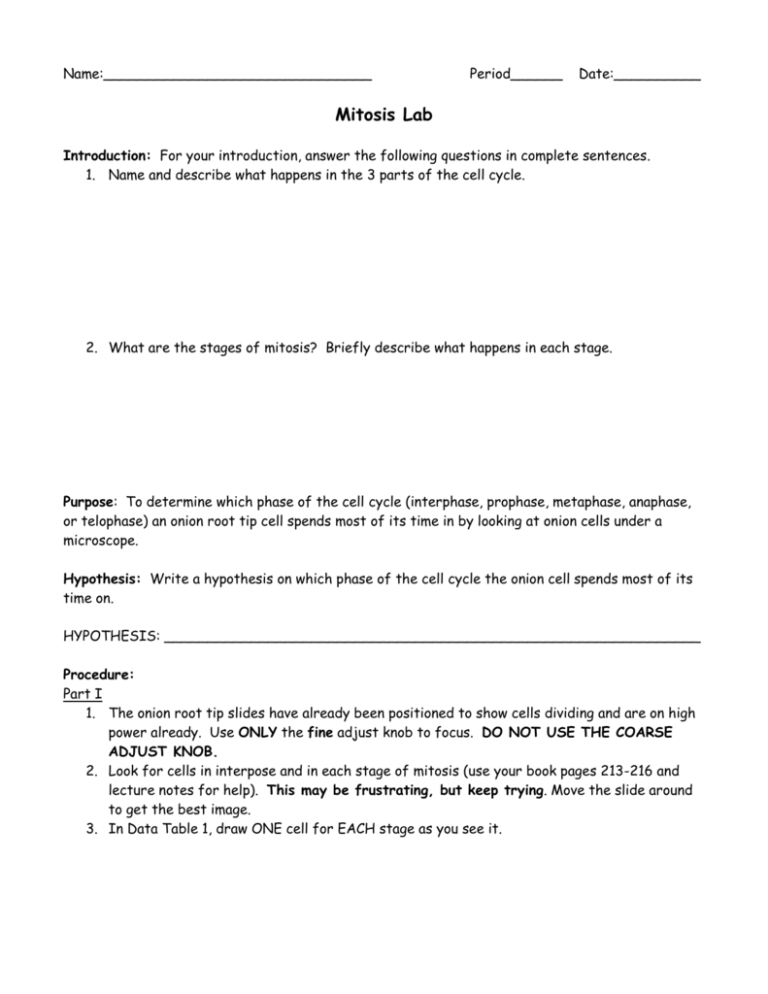
Name:_______________________________ Period______ Date:__________ Mitosis Lab Introduction: For your introduction, answer the following questions in complete sentences. 1. Name and describe what happens in the 3 parts of the cell cycle. 2. What are the stages of mitosis? Briefly describe what happens in each stage. Purpose: To determine which phase of the cell cycle (interphase, prophase, metaphase, anaphase, or telophase) an onion root tip cell spends most of its time in by looking at onion cells under a microscope. Hypothesis: Write a hypothesis on which phase of the cell cycle the onion cell spends most of its time on. HYPOTHESIS: ______________________________________________________________ Procedure: Part I 1. The onion root tip slides have already been positioned to show cells dividing and are on high power already. Use ONLY the fine adjust knob to focus. DO NOT USE THE COARSE ADJUST KNOB. 2. Look for cells in interpose and in each stage of mitosis (use your book pages 213-216 and lecture notes for help). This may be frustrating, but keep trying. Move the slide around to get the best image. 3. In Data Table 1, draw ONE cell for EACH stage as you see it. Part II 1. Look under the microscope again, but this time don’t move the slide. From high power, estimate how many cells are in each phase and record these numbers into Data Table 2. 2. Add these numbers up and find the total number of cell under the field of view (area you see when looking into the microscope). Record your data in Data Table 2. 3. Find the percentage of cells in each phase by using the formula on the back of this sheet and record your numbers into Data Table 2. Remember: When adding up percentages, they should equal 100. 4. Calculate the amount of time spent in each phase using the formula on the back and record the numbers into Data Table 2. 5. Convert the percentages into degrees of a circle using the formula on the back and record into Data Table 2. 6. Using a compass and protractor, make a pie graph of your results using the numbers that you converted into degrees. Data Table 1: Onion Root Tip Drawings Interphase Prophase Metaphase Anaphase Telophase Data Table 2: # of Cells Interphase Prophase Metaphase Anaphase Telophase 494 12 7 3 9 Total % of Cells 100% Time in each phase 1440 minutes Degrees on Pie Graph 360 Degrees Formulas to Use: Percentage of Cells in Phase Number of Cells in Phase = Total Number of Cells x 100 It takes about 24 hours for a cell to go through one division. There are 1,440 minutes in a day (24 hrs x 60min/hr). Use the formula below to calculate the amount of time a cell spends in each phase. Time in each phase = % of cells in phase x 1440 Now convert your percentages into degrees using the following formula. Degrees on a pie graph = % of cells in phase x 360 Pie Graph: Use a compass to make a circle, then use a protractor to cut “slices” into your graph showing each phase of the cell cycle. Color and label each section so that it is easy to read Conclusion: 1. Restate your purpose and hypothesis. 2. Explain your results by answering the following questions: a. How much time does a cell spend in each phase of the cell cycle? b. In which phase does a cell spend of its time? Why is this? 3. How does this lab relate to what we have been studying? 4. Write a question that could lead to further investigation on this topic.
