Onion Root Tip Cell Cycle Lab Activity
advertisement
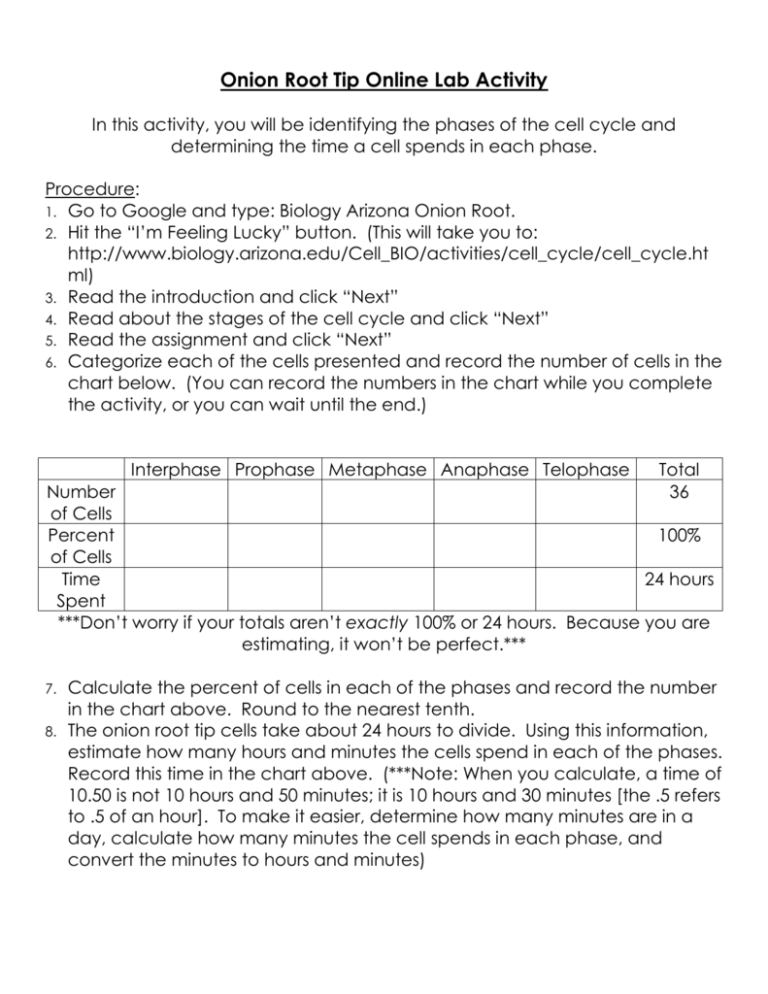
Onion Root Tip Online Lab Activity In this activity, you will be identifying the phases of the cell cycle and determining the time a cell spends in each phase. Procedure: 1. Go to Google and type: Biology Arizona Onion Root. 2. Hit the “I’m Feeling Lucky” button. (This will take you to: http://www.biology.arizona.edu/Cell_BIO/activities/cell_cycle/cell_cycle.ht ml) 3. Read the introduction and click “Next” 4. Read about the stages of the cell cycle and click “Next” 5. Read the assignment and click “Next” 6. Categorize each of the cells presented and record the number of cells in the chart below. (You can record the numbers in the chart while you complete the activity, or you can wait until the end.) Interphase Prophase Metaphase Anaphase Telophase Total 36 Number of Cells Percent 100% of Cells Time 24 hours Spent ***Don’t worry if your totals aren’t exactly 100% or 24 hours. Because you are estimating, it won’t be perfect.*** 7. 8. Calculate the percent of cells in each of the phases and record the number in the chart above. Round to the nearest tenth. The onion root tip cells take about 24 hours to divide. Using this information, estimate how many hours and minutes the cells spend in each of the phases. Record this time in the chart above. (***Note: When you calculate, a time of 10.50 is not 10 hours and 50 minutes; it is 10 hours and 30 minutes [the .5 refers to .5 of an hour]. To make it easier, determine how many minutes are in a day, calculate how many minutes the cell spends in each phase, and convert the minutes to hours and minutes) Analysis and Conclusion: 1. In which phase of the cell cycle does a cell spend most of its time? The least time? 2. Make a Bar Graph below using your answer from #1 showing the number of cells in each phase of the cell cycle. Be sure to include a title and label each axis. 3. In which phase of mitosis does a cell spend most of its time? The least time? 4. Make a Pie Chart showing each phase of the cell cycle as part of a whole. Use the information you calculated in the last row of the chart.
