Lab: Cell Cycle Computer Activity
advertisement
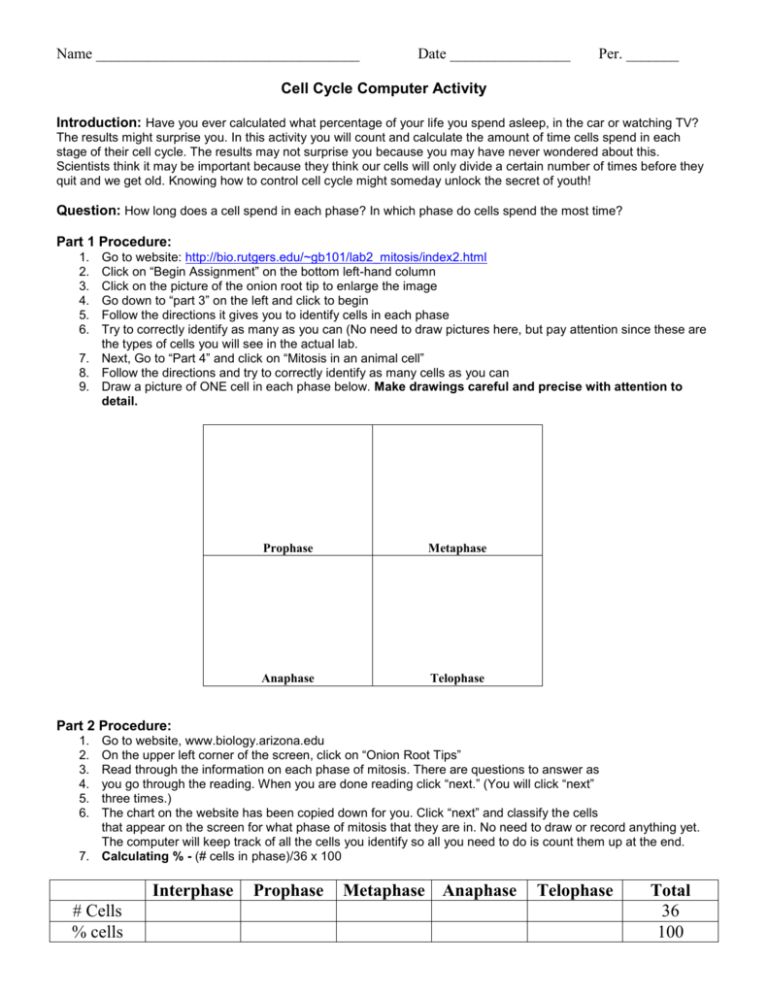
Name ___________________________________ Date ________________ Per. _______ Cell Cycle Computer Activity Introduction: Have you ever calculated what percentage of your life you spend asleep, in the car or watching TV? The results might surprise you. In this activity you will count and calculate the amount of time cells spend in each stage of their cell cycle. The results may not surprise you because you may have never wondered about this. Scientists think it may be important because they think our cells will only divide a certain number of times before they quit and we get old. Knowing how to control cell cycle might someday unlock the secret of youth! Question: How long does a cell spend in each phase? In which phase do cells spend the most time? Part 1 Procedure: 1. 2. 3. 4. 5. 6. Go to website: http://bio.rutgers.edu/~gb101/lab2_mitosis/index2.html Click on “Begin Assignment” on the bottom left-hand column Click on the picture of the onion root tip to enlarge the image Go down to “part 3” on the left and click to begin Follow the directions it gives you to identify cells in each phase Try to correctly identify as many as you can (No need to draw pictures here, but pay attention since these are the types of cells you will see in the actual lab. 7. Next, Go to “Part 4” and click on “Mitosis in an animal cell” 8. Follow the directions and try to correctly identify as many cells as you can 9. Draw a picture of ONE cell in each phase below. Make drawings careful and precise with attention to detail. Prophase Metaphase Anaphase Telophase Part 2 Procedure: 1. 2. 3. 4. 5. 6. Go to website, www.biology.arizona.edu On the upper left corner of the screen, click on “Onion Root Tips” Read through the information on each phase of mitosis. There are questions to answer as you go through the reading. When you are done reading click “next.” (You will click “next” three times.) The chart on the website has been copied down for you. Click “next” and classify the cells that appear on the screen for what phase of mitosis that they are in. No need to draw or record anything yet. The computer will keep track of all the cells you identify so all you need to do is count them up at the end. 7. Calculating % - (# cells in phase)/36 x 100 Interphase # Cells % cells Prophase Metaphase Anaphase Telophase Total 36 100 8. The percentage of cells found in each phase is a measure of how long each phase lasts. Mitosis in onion cells takes about 80 minutes. Calculate (show work) the time for each phase using this formula: Time (in minutes) = percentage x 80 minutes 100 9. Record in data table Data Phase Prophase Metaphase Anaphase Telophase Interphase Time (in min) 900 Pie Chart Now go to excel and create a pie chart of the cell’s lifecycle. 1. 2. 3. 4. 5. 6. 7. Open Excel In column A of the worksheet, enter the names of the phases – Interphase, Prophase, Metaphase, Telophase In Column B of the worksheet, enter the times spent in each phase (in minutes) Highlight all of the boxes that you filled in Go to the insert tab at the top and click on the “pie” icon and excel will then create the chart for you Pick the type of pie chart you want (make sure it is one with a title), using the “chart layouts” in the top center You can then double click on the chart itself to edit the title or make any changes you like. Please title your chart – “The Cell Cycle” 8. When the chart looks the way you want it, click on the “move chart” icon at the top right and select “new sheet” 9. Your chart will be moved to a new page 10. Print this page and staple it to your paper. *Note – you can also make your chart in google sheets following a very similar procedure. If you choose to use google sheets, please print out your chart instead of sharing it.
