THE SCIENTIFIC METHOD WORKSHEET
advertisement

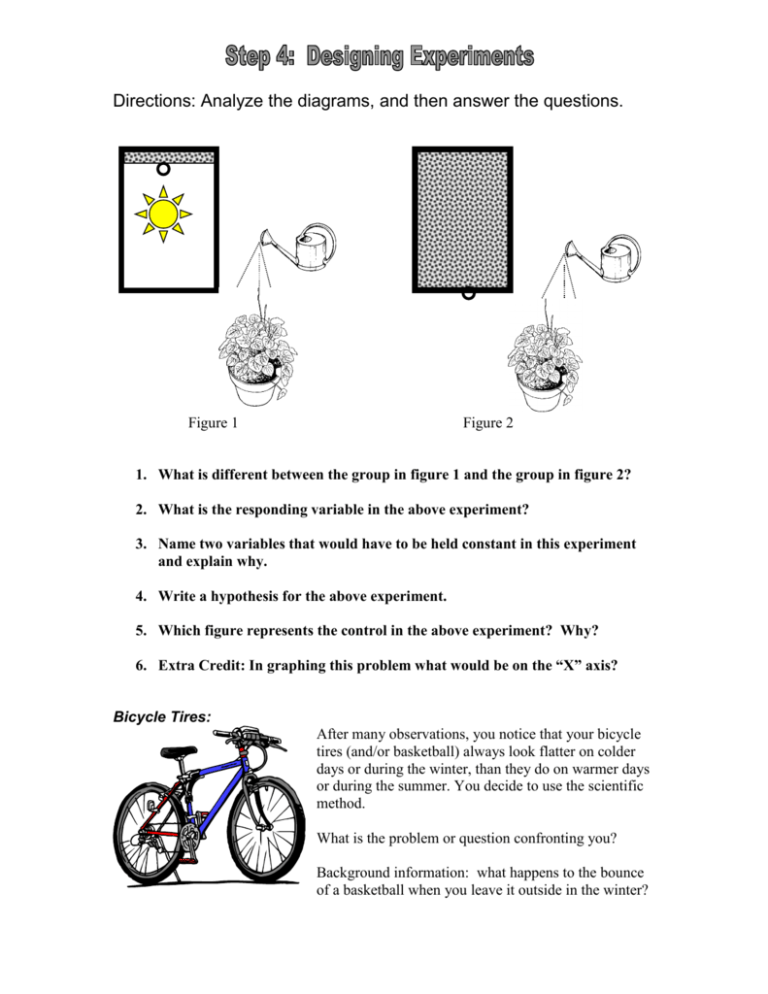
Directions: Analyze the diagrams, and then answer the questions. Figure 1 Figure 2 1. What is different between the group in figure 1 and the group in figure 2? 2. What is the responding variable in the above experiment? 3. Name two variables that would have to be held constant in this experiment and explain why. 4. Write a hypothesis for the above experiment. 5. Which figure represents the control in the above experiment? Why? 6. Extra Credit: In graphing this problem what would be on the “X” axis? Bicycle Tires: After many observations, you notice that your bicycle tires (and/or basketball) always look flatter on colder days or during the winter, than they do on warmer days or during the summer. You decide to use the scientific method. What is the problem or question confronting you? Background information: what happens to the bounce of a basketball when you leave it outside in the winter? What hypothesis would you develop? How would you perform such an experiment to test your hypothesis? (Hint: you would probably use a smaller object.) How would you record your data? How would you analyze your data? What would you include in you conclusion? Should you repeat your experiment after it works correctly the first time? Explain. What is Pasteurization? Louis Pasteur was a famous scientist. As you know when you leave milk out it spoils. When Pasteur was alive, people thought that certain cows were more likely (than others) to cause milk spoilage because they produced an inferior type of milk. However Pasteur thought it might have to do with bacteria. He set up an experiment where he used two glasses of milk. In one of the glasses he added boiled milk. He discovered that the boiled milk did not spoil as fast as the un-boiled milk. He told his colleagues; and when his colleagues tried the experiment, they got the same results. 1. What was the problem for Pasteur? 2. What was his opinion on the problem? 3. What do you think was his hypothesis? 4. What was the manipulated variable? 5. What was the variable he measured? 6. What variable do you think he had to keep constant? 7. How did he verify his facts? Which group was the control: the boiled milk, or the unboiled milk. Explain. A student sought to discover the best household material for absorbing oil. He used cotton ball, a kitchen sponge, and some paper towels to clean up 5ml of olive oil that he spilled on a brick. After poured the oil on the brick, he first uses cotton balls. Then on the same spot of oil he used the sponge, followed by the paper towels. No matter what he did, an oily spot remained on the brick. Describe how he could have changed his investigation to better prove which material was best at cleaning up olive oil. Problem: Hypothesis: Materials: Procedures: Data: (Data table only) Analysis: Conclusion: What is his manipulated variable? What is his responding variable? What variables would he have to keep constant? Operational definitions clear up the vagueness and/or the ambiguity of certain terms. Write two possible operational definitions for the underlines variables in the space provided. 1. Select the tomato that grows the best. 2. On a cold day, determine what happens to a can of soda left outside. 3. Rearrange the Refrigerators at Best Buy with the largest ones in the front. 4. People who sleep at least 8 hours per day are probably better drivers. 5. Students who sleep at least 8 hours per day are probably better students. 6. After touching the bearded dragons, make sure you wash your hand thoroughly. Going Further What do you think the downside is of not having good operational definitions? Directions: Examine the data below. Then graph your data using a double line graph. After you have completed the graph, answer the questions that follow. Deer and Wolf Population in Wilderness County: Year 1920 1930 1940 1950 1960 1970 Wolf Population 800 500 400 300 200 200 Deer Population 20000 30000 50000 75000 30000 20000 Answer in complete sentences: 1. What was the general trend of the wolf population? 2. List at least two possible reasons to explain this. 3. What happened, at first, to the deer population as the wolf population changed? 4. Why do you think the deer population changed in from 1950 – 1970? List two possible reasons. 5. What would you normally expect to happen to the deer population when the wolf population declines? Did this happen? Explain in 4-5 sentences. Jack and Jill are studying heat. They are posed with a problem. They wonder whether the color of a container will affect how much heat that color will retain. Jack said, “If I put hot water in a dark can and a light can, then they will cool down at the same rate.” Jill said, “If I put hot water in a dark can and a light can, then the dark can will cool down faster.” They designed and cooperatively conducted an experiment using light colored and dark colored soup cans. Their data table is below: Time (Minutes) Start 5 10 20 30 40 50 60 70 Light Can Temp 0C 100 90 70 50 40 30 25 20 20 Dark Can 100 70 50 30 25 22 21 20 20 Temp 0C Directions: Answer in complete sentences where applicable. 1. Graph this data in a double line graph. 2. Compare the two line on your graph: How was the cooling the same? 3. Compare the two line on your graph: How was the cooling different? Remember that a conclusion is written in paragraph format. A conclusion states whether your hypothesis was correct or incorrect and why. A conclusion should also refer back to your data and your analysis in support of your written statements. 4. Write Jill’s conclusion in 4-5 sentences. 5. Write Jack’s conclusion in 4-5 sentences Hint: Both Jack and Jill had a start temperature of 100 degrees; and both cans reached 20 degrees after 60 minutes – the exact same time. Isn’t this like a race between the tortoise and the hare. Which one runs faster? (Answer: the hare) But, what happens when they both cross the finish line at the same time? Was the hare still faster? (with teacher demonstrations *) Variables are factors that could change in an experiment. In well-designed experiments, only one factor is purposely changed so that we can measure the response it causes in another factor. In a well designed experiment all the other factor that we not testing must be held constant. As an example, suppose you had the following hypothesis: “If I dip steel wool in different temperatures of water, then the steel wool will rust at different rates.” Independent variable = temperature Dependant variable = rate of rusting Constant variable = amount of steel wool used, type of steel wool, amount of water For the problems below: Using the background information you have, develop a testable hypothesis for each one of the Problems. Then identify the independent and the dependent variable. 1. Problem: What is the relationship between SPF strength and sunburn? Hypothesis: If a person uses a higher numbered SPF, then they will become less sunburned. IV___________________ DV___________________________ 2. Problem: What is the relationship between frequency of brushing teeth and cavities? Hypothesis: If a person brushes his teeth more, then they will have less cavities. IV___________________ DV___________________________ 3. Problem: What is the effect of instant messaging on students’ grades. Hypothesis: If student spend more time using IM, then their GPA will be less. IV___________________ DV___________________________ 4. Problem: How does the angle of light affect the temperature of the surface? * Hypothesis:_________________________________________ IV_____________________ DV________________________ 5. Problem: How does an increase in sea otters affect the population of the abalone? 6. Problem: How does the amount of smoking affect emphysema rates? 7. Problem: How does air pressure affect the boiling point of water? 8. Problem: How does humidity affect the amount of time it takes clothes to dry? 9. Problem: How does water temperature affect the amount of salt that can be dissolved? * 10. Problem: What is the effect of snowboard length on snowboard speed? 11. Problem: What is the effect of plant food on the number of flowers produced? 12. Problem: What is the effect of an object’s height on its amount of energy? * 13. Problem: What is the effect of surface area on evaporation? Finally in three or four sentences describe how you would conduct each experiment to test your hypothesis. Answer the following questions on a separate sheet of paper. 1. You want to figure out whether the shape of a container affects the rate of which water freezes in that container. Write a hypothesis for this problem. What is the manipulated variable? What is the responding variable? What are some of the variable that you would need to control? Do you need an operational definition? If so, what is that definition? 2. You think that if you change the temperature of your refrigerator, than you can have your batteries last longer in storage. Write a hypothesis for this problem. What is the manipulated variable? What is the responding variable? What are some of the variable that you would need to control? Do you need an operational definition? If so, what is that definition? 3. You are confused about which laundry detergent is really best at removing stains. You decide to conduct an experiment to finally decide for all of American which laundry detergent works best. What is the manipulated variable? What is the responding variable? What are some of the variables that you would need to control? Do you need an operational definition? If so, what is that definition? 4. You are confused about which brand of paper towel is really the strongest. You decide to conduct an experiment to finally decide for all of American which paper towel works best. Write a hypothesis for this problem. What is the manipulated variable? What is the responding variable? What are some of the variable that you would need to control? Do you need an operational definition? If so, what is that definition? 5. For two of the above problems, using a minimum of 5 sentences, describe how you would conduct an experiment to test the hypothesis that you have written.


