September 26, 2014 DFR 1: Estimating Discount Rates
advertisement
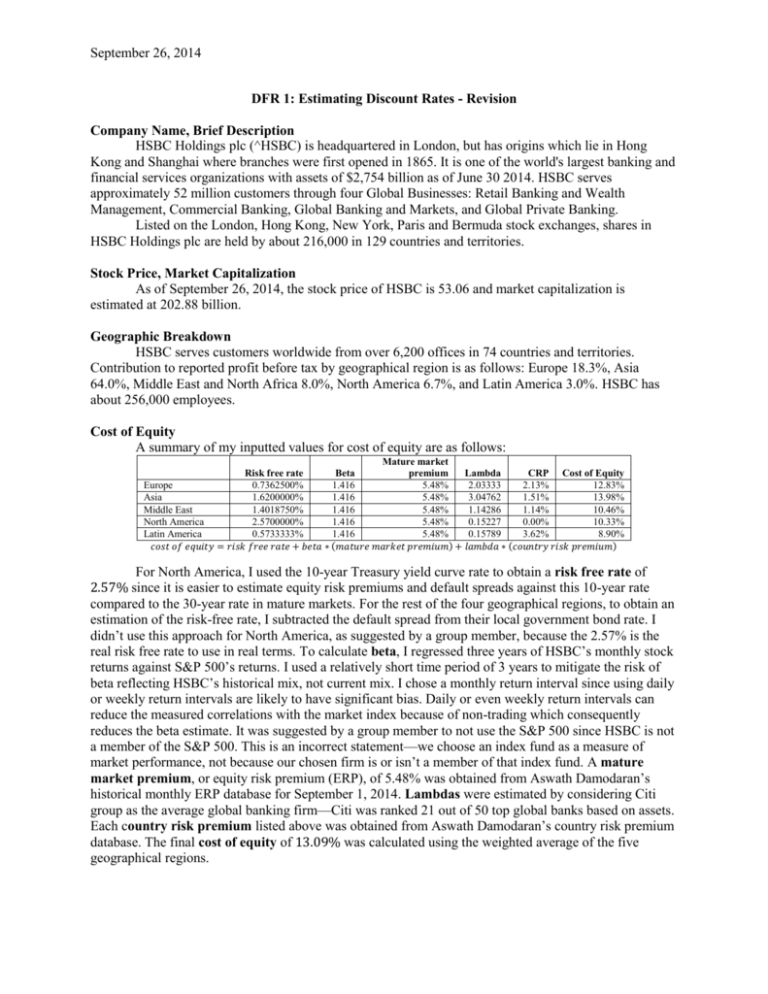
September 26, 2014 DFR 1: Estimating Discount Rates - Revision Company Name, Brief Description HSBC Holdings plc (^HSBC) is headquartered in London, but has origins which lie in Hong Kong and Shanghai where branches were first opened in 1865. It is one of the world's largest banking and financial services organizations with assets of $2,754 billion as of June 30 2014. HSBC serves approximately 52 million customers through four Global Businesses: Retail Banking and Wealth Management, Commercial Banking, Global Banking and Markets, and Global Private Banking. Listed on the London, Hong Kong, New York, Paris and Bermuda stock exchanges, shares in HSBC Holdings plc are held by about 216,000 in 129 countries and territories. Stock Price, Market Capitalization As of September 26, 2014, the stock price of HSBC is 53.06 and market capitalization is estimated at 202.88 billion. Geographic Breakdown HSBC serves customers worldwide from over 6,200 offices in 74 countries and territories. Contribution to reported profit before tax by geographical region is as follows: Europe 18.3%, Asia 64.0%, Middle East and North Africa 8.0%, North America 6.7%, and Latin America 3.0%. HSBC has about 256,000 employees. Cost of Equity A summary of my inputted values for cost of equity are as follows: Mature market Risk free rate Beta premium Lambda CRP Cost of Equity Europe 0.7362500% 1.416 5.48% 2.03333 2.13% 12.83% Asia 1.6200000% 1.416 5.48% 3.04762 1.51% 13.98% Middle East 1.4018750% 1.416 5.48% 1.14286 1.14% 10.46% North America 2.5700000% 1.416 5.48% 0.15227 0.00% 10.33% Latin America 0.5733333% 1.416 5.48% 0.15789 3.62% 8.90% 𝑐𝑜𝑠𝑡 𝑜𝑓 𝑒𝑞𝑢𝑖𝑡𝑦 = 𝑟𝑖𝑠𝑘 𝑓𝑟𝑒𝑒 𝑟𝑎𝑡𝑒 + 𝑏𝑒𝑡𝑎 ∗ (𝑚𝑎𝑡𝑢𝑟𝑒 𝑚𝑎𝑟𝑘𝑒𝑡 𝑝𝑟𝑒𝑚𝑖𝑢𝑚) + 𝑙𝑎𝑚𝑏𝑑𝑎 ∗ (𝑐𝑜𝑢𝑛𝑡𝑟𝑦 𝑟𝑖𝑠𝑘 𝑝𝑟𝑒𝑚𝑖𝑢𝑚) For North America, I used the 10-year Treasury yield curve rate to obtain a risk free rate of 2.57% since it is easier to estimate equity risk premiums and default spreads against this 10-year rate compared to the 30-year rate in mature markets. For the rest of the four geographical regions, to obtain an estimation of the risk-free rate, I subtracted the default spread from their local government bond rate. I didn’t use this approach for North America, as suggested by a group member, because the 2.57% is the real risk free rate to use in real terms. To calculate beta, I regressed three years of HSBC’s monthly stock returns against S&P 500’s returns. I used a relatively short time period of 3 years to mitigate the risk of beta reflecting HSBC’s historical mix, not current mix. I chose a monthly return interval since using daily or weekly return intervals are likely to have significant bias. Daily or even weekly return intervals can reduce the measured correlations with the market index because of non-trading which consequently reduces the beta estimate. It was suggested by a group member to not use the S&P 500 since HSBC is not a member of the S&P 500. This is an incorrect statement—we choose an index fund as a measure of market performance, not because our chosen firm is or isn’t a member of that index fund. A mature market premium, or equity risk premium (ERP), of 5.48% was obtained from Aswath Damodaran’s historical monthly ERP database for September 1, 2014. Lambdas were estimated by considering Citi group as the average global banking firm—Citi was ranked 21 out of 50 top global banks based on assets. Each country risk premium listed above was obtained from Aswath Damodaran’s country risk premium database. The final cost of equity of 13.09% was calculated using the weighted average of the five geographical regions. September 26, 2014 Cost of Debt A summary of my inputted values for cost of debt are as follows: Europe Asia Middle East North America Latin America Risk Free Rate 0.736% 1.620% 1.402% 2.570% 0.573% Company default spread* 0.65% 0.65% 0.65% 0.65% 0.65% Lambda 2.03333333 3.04761905 1.14285714 0.15227273 0.15789474 Adjusted country default spread 2.344% 2.450% 3.278% 0.000% 3.617% Tax Rate 26.30% 28.20% 27.15% 37.30% 31.70% After Tax Cost of Debt 4.53% 6.99% 4.22% 2.02% 1.23% The long term/senior rating and outlook given to HSBC by Fitch, Moody’s, and Standard & Poor’s are AA- Stable, Aaa3 Negative, and A+ Negative, respectively. A company default spread of 0.65% was thus chosen. Adjusted country default spreads were taken from Aswath Damodaran’s country risk premium database. Marginal tax rates were used which were calculated by using the weighted averages of each geographic region’s countries as based on the Tax Foundation. A final cost of debt of 5.81% was calculated using weighted average of the after tax cost of debt for each of the five geographical regions. Please see the next page for the Appendix. September 26, 2014 Appendix Excel File Embedded is the Excel file for beta, lambda, cost of equity, and cost of debt calculations. Each calculation is in a separate tab. chu.revision1_excel.xl sx Sources https://www.us.hsbc.com/1/2/home/about/corporate/facts http://www.hsbc.com/investor-relations http://www.google.com/finance?q=NYSE%3AHSBC&ei=KVkgVLDqAcmP8AbGn4DIAw http://www.bloomberg.com/quote/HSBC:US http://www.hsbc.com/investor-relations/fixed-income-securities/credit-ratings#HSBC Holdings plc|All rating agencies|All rating types http://analysisreport.morningstar.com/stock/research?t=HSBA&region=gbr&culture=enUS&productcode=MLE http://www.hsbc.com/investor-relations/financial-and-regulatory-reports http://www.treasury.gov/resource-center/data-chart-center/interest-rates/Pages/TextView.aspx?data=yield http://people.stern.nyu.edu/adamodar/pdfiles/papers/riskfreerate.pdf http://pages.stern.nyu.edu/~adamodar/New_Home_Page/datafile/ctryprem.html http://pages.stern.nyu.edu/~ADAMODAR/New_Home_Page/datafile/implpr.html http://www.stern.nyu.edu/~adamodar/pc/datasets/ctryprem.xls http://www.citigroup.com/citi/investor/quarterly/2014/ar13c_en.pdf?ieNocache=461 http://www.accuity.com/useful-links/bank-rankings/ http://taxfoundation.org/article/corporate-income-tax-rates-around-world-2014 http://www.investing.com/rates-bonds/world-government-bonds?maturity_from=60&maturity_to=290 http://www.stern.nyu.edu/~adamodar/pc/USsovratingeffect.xlsx
