University of Cape Town The SLL for 2015 Considerations in
advertisement
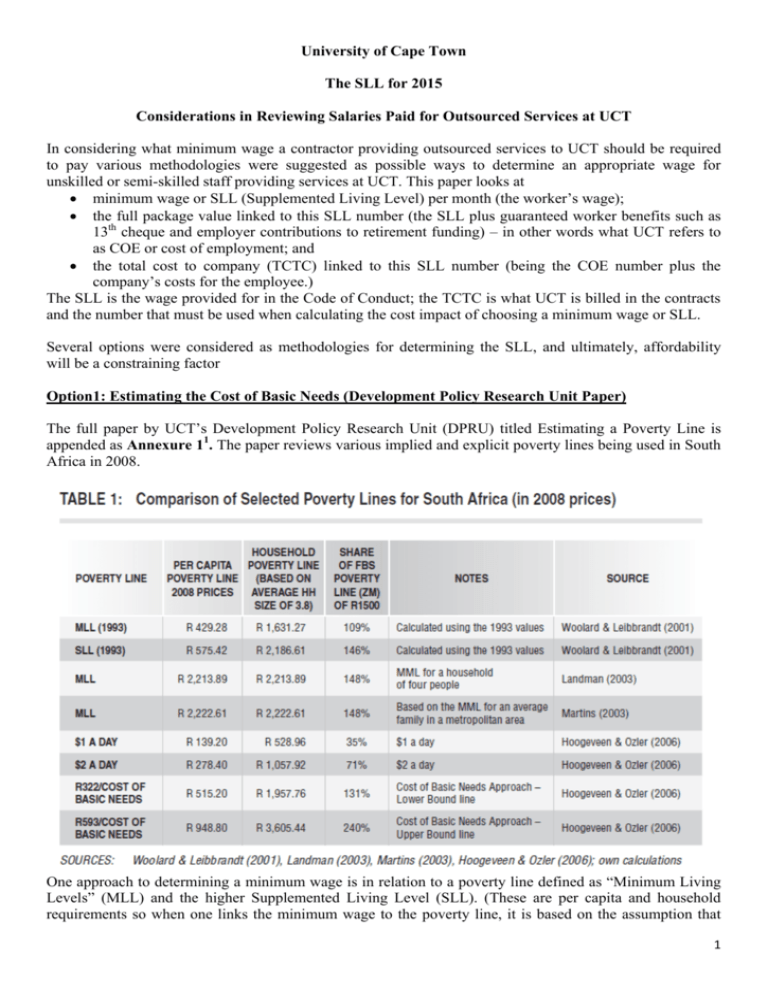
University of Cape Town The SLL for 2015 Considerations in Reviewing Salaries Paid for Outsourced Services at UCT In considering what minimum wage a contractor providing outsourced services to UCT should be required to pay various methodologies were suggested as possible ways to determine an appropriate wage for unskilled or semi-skilled staff providing services at UCT. This paper looks at minimum wage or SLL (Supplemented Living Level) per month (the worker’s wage); the full package value linked to this SLL number (the SLL plus guaranteed worker benefits such as 13th cheque and employer contributions to retirement funding) – in other words what UCT refers to as COE or cost of employment; and the total cost to company (TCTC) linked to this SLL number (being the COE number plus the company’s costs for the employee.) The SLL is the wage provided for in the Code of Conduct; the TCTC is what UCT is billed in the contracts and the number that must be used when calculating the cost impact of choosing a minimum wage or SLL. Several options were considered as methodologies for determining the SLL, and ultimately, affordability will be a constraining factor Option1: Estimating the Cost of Basic Needs (Development Policy Research Unit Paper) The full paper by UCT’s Development Policy Research Unit (DPRU) titled Estimating a Poverty Line is appended as Annexure 11. The paper reviews various implied and explicit poverty lines being used in South Africa in 2008. One approach to determining a minimum wage is in relation to a poverty line defined as “Minimum Living Levels” (MLL) and the higher Supplemented Living Level (SLL). (These are per capita and household requirements so when one links the minimum wage to the poverty line, it is based on the assumption that 1 there is only one income earner in the household.) Another approach is to establish the minimum cost to a household of meeting its basic needs. This “Cost of Basic Needs” reflected in the last two lines of the table have a lower and upper bound level based on different assumptions of what households need in different circumstances, and what other services might be available to them at subsidised costs or free (e.g. water, electricity, health care). The upper bound is almost twice the level of the lower. To anticipate the conclusion of this section, Management recommends that we use this upper bound as the basis for setting the minimum wage that outsourced employees should be paid. The CoBN from the Bhorat paper has been restated in 2014 terms using reasonable inflation measures. The report assumes a family size of 3.8 (from the 2005/6 Income and Expenditure Survey) which is retained for the purposes of the computation. However the most recent published data from the 2011 census gives the average household size for the Western Cape at 3.4 (2007 Community Survey 3.8; Census 2001 3.6) and for South Africa also at 3.4 (2007 Community Survey 3.9; Census 2001 3.8). A summary of this data going back to 1990 is appended as Annexure 22. Table 2 Updated Cost of Basic Needs Official CPI (Year on Year) Lower Limit Line Upper Limit Line Average 2008 2009 2010 2011 2012 2013 2014 10.04% 7.26% 4.10% 5.01% 5.75% 5.77% 5.92% R 1,957.76 R 2,154.32 R 2,310.72 R 2,405.46 R 2,525.98 R 2,671.22 R 2,825.35 R 3,605.44 R 3,967.43 R 4,255.46 R 4,429.94 R 4,651.87 R 4,919.36 R 5,203.20 R 2,781.60 R 3,060.87 R 3,283.09 R 3,417.70 R 3,588.93 R 3,795.29 R 4,014.28 Note that CPI in 2008 is applied to 2008 upper and lower limits to generate 2009 to 2014 data. Our recommendation is therefore an SLL of R5018.16 giving an estimated minimum Total-Cost-ToCompany of R6500. (Calculation explained later.) Option2: UCT Equivalent via Pay-Class Ranges The recommendation by the Outsourcing Review Panel was to align the remuneration of the outsourced workers with that of comparable employees within the UCT system. In 2014, UCT has no staff on its own payroll at either pay-class 1 or pay-class 2 per the UCT salary scales. UCT’s Human Resources Department has, however, in the past maintained a set of UCT COE ranges which include these two pay classes. For 2014, the published UCT COE rates for these pay-classes are as follows: Table 3 Payclass 2014 Monthly Standard Cost to CoE package Company at (60th 60th percentile) percentile R 93 448.00 Cost to Company Add 2% for statutory levies Payclass 1 (Rate per payclass) R 7 943.08 R 95 316.96 Payclass 2 (Rate per payclass) R 8 849.01 R 104 106.00 R 106 188.12 It should be noted that as UCT’s agreement with NEHAWU is to pay staff at a rate per job, there are no ranges for staff in this bargaining unit up to pay-class 4. We believe that these notional scales are in fact inappropriate to use for determining the SLL. They have been increased each year in an automatic way without review of the market as is done in other pay-classes, 2 and without differentiating the variety of jobs that fall into these pay-classes which in fact attract different wages as will become clear from the review below in option 3. Option3: Benchmarking against market rates There are different markets and hence different benchmarks that could be used for comparison. 1 Table 4 below, is extracted from UCT’s remuneration benchmarking data provider, PWC Remchannel. The information has been refined and supplemented by the UCT Human Resources Department by extracting a sample of comparative market salaries based on their alignment to UCT pay-classes and broad descriptions of related jobs. Remchannel provides data for permanent staff inclusive of guaranteed benefits. Subscribers are generally for-profit and large corporations. Table 4 Remchannel Data below are for permanent staff at Guaranteed monthly package which includes basic cash plus all guaranteed benefits including 13th cheque as at May 2014 Peromnes UCT T2 or UCT Title Grade Payclass CLEANER GARDENE R KITCHEN HELPER LABOURE R SANITATIO N ATTENDA NT TEA MAKER 18/19 1- - 17 1 16 Number of Standard companie Package s National Market National Guaranteed Package Sample 25th 50th 75th Market Mean 200 3 924 5 550 7 121 9 046 7 390 7 787 37 422 10 032 11 201 12 086 10 824 2 8 676 34 637 7 210 8 957 9 771 8 489 18/19 1- - 84 1 488 4 425 6 035 7 165 5 917 16 2 8 676 12 821 7 741 8 489 8 942 8 654 17 1 7 787 122 639 6 435 7 900 9 416 7 976 The table below is from a specially commissioned Remchannel report with specific South African tertiary institutions forming the group. However we are concerned about interpreting it since it does not accord with the direct information we obtain from other universities, and the rates of pay for some jobs seem quite out of proportion to all the other markets. It is likely that the ranges described (25th, 50th,75th) is not just across institutions but also within institutions. In other words, within each institution, the lowest paid worker would be earning below the 25th percentile, and it is this that should be compared with our SLL which is the analogous minimum wage. 1 The tables and data that follow in this section have been prepared by the UCT Human Resources Department to provide comparisons and industry perspectives. 3 Table 5 Tertiary Circle Data Peromnes UCT T2 or UCT Title Grade Payclass CLEANER 18/19 1- GARDENER 17 1 7 787 KITCHEN HELPER 16 2 LABOURER 18/19 SANITATION ATTENDANT TEA MAKER Number of Standard companie Package s 8 Higher Education Higher Education Basic Cash Higher Education Guaranteed Package market sample 25th 50th 75th 25th 50th 75th 548 4 600 5 183 7 005 6 541 7 247 10 291 14 133 5 971 7 078 8 052 9 032 10 449 13 123 8 676 3 29 8 187 9 602 9 602 10 588 12 157 13 241 1- - 11 289 3 909 5 034 5 708 6 413 7 448 9 105 16 2 8 676 0 - 0 0 0 0 0 0 17 1 7 787 5 6 0 0 0 0 0 0 Wits and the University of Johannesburg (UJ) have reported that these services are also outsourced at their institutions and indicated outsourced wage ranges from R2,000 (basic) to R6,000 per month (inclusive of benefits). UJ has established a cleaners trust fund amounting to R1m per annum to provide for annual bonuses to high performing cleaning staff as there have been performance concerns. Wits offers training and development for outsourced staff. Rhodes is currently insourced and reported wage ranges from R4,700 (basic) to R6,400 per month (inclusive of benefits). Table 6 Sectoral determinations The following National Sector information was obtained from the South African Government Gazette statistics Sept 2013 Monthly wage calculated at 45 hours per week Salary Range Reported Title Driver (Light Motor Vehicle) Driver (Medium Motor Vehicle) General worker min max 2 366 2 820 Bonus 13th cheque Adjusted Salary Range (including 13th cheque ) min max 2 563 Remuneration Comments 3 055 See comments below 2 563 3 039 1 881 2 272 Handyman 2 660 3 121 Security Officer 2 441 (Grade A to Grade E) 4 077 Cleaning Staff 3 044 2 817 13th cheque 2 777 3 292 2 038 2 461 2 882 3 381 13th cheque 2 644 4 417 13th cheque 3 052 3 298 13th cheque 13th cheque 4 The Sectoral Determination specifies the minimum wages payable for all workers in that sector that are not covered by a bargaining council. Public sector workers are excluded, as there is a bargaining council. In the case of contract cleaning (CC) & private security, Professor Woolard’s2 view from the public hearings and site visits is that the vast majority of workers earn exactly the minimum. For CC there is a provident fund of 7.5%, which is above the wage. There is also a guaranteed 13th cheque. Some further context can be added by considering wages for staff employed in other sectors of the economy. Auto Industry - the negotiated rate for a cleaner affiliated to the National Union of Metalworkers of South Africa (NUMSA) is pegged at R3,100 per month on a CTC basis at present, while the salary for a newly qualified auto worker or mechanic/technician with 1 to 2 years’ experience is R8,000. Table 7. Fedics and Metro Title UCT Work site - Entry level UCT Work site - Workers Off Site Workers Fedics Basic TCTC Salary R4 R6 433.75 047.80 R4 R6 600.75 250.76 R2 R3 692.95 241.78 Bonus 13th cheque 13th cheque 13th cheque Metro TCTC Basic Salary R 4 703.52 R 4 703.52 R 2 712.32 R6 018.00 R6 018.00 R3 470.40 Metro: (TCTC) Total Cost To Company: basic plus 27.95%, which includes: leave pay, sick leave, UIF, SD levy, WCA, NCCA levy, Family responsibility Leave, Provident fund, Annual Bonus Fedics: TCTC: basic plus 36.4%, which includes: Night shift allowance; leave pay; COIDA; Provident Fund; UIF; 13th cheque provision and Profit Share. Table 8 UCT NORMAL DAY SHIFT : 173.20 HOURS Normal Time Hourly Wage Rate Unemployment Insurance Fund ER Skills Development Levy Workman's Compensation Levy Provident Fund ER Provident Fund EE Sick Leave Provision Annual Leave Provision Bonus Provision Bargaining Council Levy Average Cost Hourly Monthly R 27.16 4 704.11 1% R 0.27 47.04 1% R 0.27 47.04 0.51% R 0.14 23.99 5.25% R 1.43 246.97 5.25% Paid by employee 3.85% R 1.05 181.11 5.77% R 1.57 271.43 8.33% R 2.26 391.85 n/a n/a R 5 913.54 For comparison purposes with market data, the guaranteed monthly package (salary, provident plus annual bonus) for Supercare is R5342. 2 Economist in UCT School of Economics 5 The question of benchmarks is thus really complex, with a very wide range of wages being paid depending on the precise job, whether determined by a minimum wage sectoral determination or wage bargaining, whether in the public sector or private, and presumably largely influenced by what particular companies and sectors find affordable. One summary perspective on benchmarking was offered by Prof Haroon Bhorat, Director of the DPRU. “… It is really quick and dirty exercise, but the take-home point is that at R8000 as a minimum wage, we would be paying workers close to a tertiary degreed individual's mean wage, and at the 93rd percentile of the national wage distribution.” Teaching - the state in 2014 pays a newly qualified teacher R15,400 while a teacher with more than 3 years’ experience is paid R18,400. A grade head or phase head with at least 10 years’ experience is paid R23,500. Nursing - current data for the salaries paid to nurses indicated that a Staff Nurse would earn in the order of R10,500 per month moving up to circa R13,722 with experience. These rates are broad averages as reported by www.salaryexplorer.com and thus combine what is paid in both the private and public sectors. A full report by the DPRU considering the appropriateness of a salary of R8,000 per month for unqualified staff is appended as Annexure 33. Option 4: Ratio between lowest and highest paid should not exceed 1:8 Various sources suggest that there should be some form of linkage/capping between the salary paid to the lowest earning employee at an entity and the salary paid to the highest paid employee at the same entity. Ratios suggested vary between 1:8 up to 1:30 depending on the source of the publication, the industry, the country of operation and a host of other factors. One very important factor in determining an appropriate ratio must be the country specific factors. In very blunt terms, executive level staff can be considered an international commodity and are thus employable and in demand globally and the salaries thus paid to attract and retain such talent need to be internationally competitive and aligned. Unskilled staff cannot be seen as an international commodity and as such, appropriate compensation for these types of jobs will be aligned to local rates, supply and demand. Thus for example, a ratio of 1 to 20 may work in some developed European countries where both salaries are denominated in a global currency such as the Euro, but when one considers South Africa, the executive salary is aligned to that of the international market (Euro or Dollar) while the unskilled salary is aligned to the South African market (South African Rand). Given the limited scope of this review it is impossible to review all the available evidence and posit a ratio that may be appropriate in this case. Furthermore, ratios of highest to lowest paid need to be used cautiously; one outlier distorts the general picture. Ratios are a function of numerator and denominator. Movements in either of these variables in either direction can influence the result in a spurious way. Ratio of Highest Salary Possibilities Vice-Chancellors Salary Monthly Ratio Salary for lowest at ratio Monthly R 2 421 942 R 201 829 8 R 302 743 R 25 229 16 R 151 371 R 12 614 20 R 121 097 R 10 091 24 R 100 914 R 8 410 27 R 89 702 R 7 475 30 R 80 731 R 6 728 Note that this is the annualised cost to company salary excluding accruals for deemed benfits for 2013. Using a ratio of 8 would place the lowest earner somewhere between UCT pay-classes 8 and 9, while the current UCT pay-class 1 rate for job is R7,943 which is at a ratio around 26. Factors and Implications to Consider 6 UCT has clearly articulated that in terms of its social and moral values it does not wish to exploit individuals, be they UCT staff or the staff of contractors providing services to UCT. This concern has been effected in the past several years by the application of the Supplemented Living Level (SLL) wage (when the measure was still published and updated) and this base rate has been updated annually by the Quintile 2 CPI as published by Stats SA in June of each year. The SLL rate for 2014 is R4,703.52 per month. However, the SLL rate does not include the cost/vlaue of benefits (retirement fund contributions made by the employer and 13th cheques); overtime and other non-guaranteed allowances; or other costs that add to the TCTC (total cost to company). These costs are incurred by the service providers and are billed back to UCT. The cost and recharge of these benefits have been computed in respect of the cost they add to SLL and the average rate is somewhere between 28% and 35% of the SLL rate (dependant on the contractor, the hours/shifts worked by staff and other related factors). While some of these additional items would not be considered true salary benchmark costs in comparing cost to company data, they are none the less costs that are computed on a percentage add on basis and if UCT were to require a revision to the SLL rate, these costs would increase at a similar rate. Thus, if one assumes a reasonable rate for these costs at 30% of SLL, then a derived total cost to company (TCTC) for an SLL rate of R4 703.52 per month would be in the order of R6,115 per month. Affordability must clearly be a major factor in determining how generous UCT-prescribed minimum wages should be when these are above market rates. Should UCT set a higher minimum for outsourced workers the funds to pay for this would have to come from a reduction in staff numbers with consequent reduction in service levels; and/or increased students housing fees (for the costs atrributable to student housing; Increased tuition fees (for other increased costs). Our current SLL rate of R4,703.52 already exceeds all the MLLs and SLLs in Option 1 and also exceeds the Cost of Basic Needs lower line of R2,825.35 (table 2) by some margin. We are recommending that the SLL be determined with reference to the upper Cost of Basic Needs level updated table presented in Option 1, that is to say between R5000 and R5,200 per month. It is also worth repeating that the SLL rate is the minimum that UCT requires outsourced contractors to pay staff so in the case of some categories of external staff the SLL has no real impact as they are already paid above the minimum rate. Having said that, if the SLL rate is pushed up, there is a very real danger of several higher scales sliding up since the immediate supervisors and more skilled workers would otherwise find that the increment between the lowest paid and their wages was too narrow. This may result in a cost increase a lot larger than might be envisaged. This complicates the task of estimating the additional costs to UCT were the SLL rate to be increased. . The data to hand suggests that of the total cohort of staff employed by our contracted service providers, some 700 would be cleaners, labourers, etc. that would be at the lower end of the current levels relative to SLL. Skilled staff such as bus drivers, security officers, chefs, etc. are some way above the minimum already. The table below attempts to indicate possible levels and increased costs. 7 Estimated Costs Associated with SLL Options Current SLL Cost of Benefits at 30% SLL on Cost to Company Basis Staff on Lowest Level Annual Cost Difference % change Current SLL 1 SLL 2 SLL 3 R 4,703.52 R 5,000.00 R 5,200.00 R 5,750.00 R 1,411.06 R 1,500.00 R 1,560.00 R 1,725.00 R 6,114.58 R 6,500.00 R 6,760.00 R 7,475.00 700 700 700 700 R 51,362,438 R 54,600,000 R 56,784,000 R 62,790,000 R 3,237,562 R 5,421,562 R 11,427,562 6.30% 10.56% 22.25% Note that these are very rough estimates and cannot estimate costs of possible upward push on other staff groupings. As noted previously, some 40% of the staff deployed by service providers are above the minimum rate already and a change to the lowest cohort could thus also push the others up. The impact of this is hard to estimate with any accuracy and the best option may be to simply apply the percentage changes in the table above to the existing staffing costs of the contracts to get something that approaches a more likely cost outcome. This is attempted in the table below using the rates illustrated in the table above. Impact of Recommendation on Fees Cost to Company SLL Rate % change 2014 Contracts Value Total Less: Food cost on Catering Less: Estimate of Other Non-Staff Costs Staffing Cost Portion of 2014 Contracts Less: Housing Cleaning Metro (2013 Budget) [A] Less: G4S Housing Share (2013 Budget) [B] Less: Housing Fedics (2013 Budget) [C] Contracts Staffing: Tuition [D] Potential Increase Tuition [D] Potential Increase Housing (excl Meals) [A]+[B] Potential Increase Housing (Catering) [C] Tuition Fee Budget 2014 Housing Fee Budget 2014 (excl Meals) Housing Fee Budget 2014 Catering Staffing Current R 6,114.58 SLL 1 R 6,500.00 6.30% SLL 2 R 6,760.00 10.56% SLL 3 R 7,475.00 22.25% R 3,455,894 R 2,260,609 R 1,418,110 R 5,787,177 R 12,198,206 R 3,785,575 R 7,979,231 R 2,374,742 R 5,005,478 R 154,542,392 R 23,355,000 R 18,000,000 R 113,187,392 R 18,011,305 R 17,852,230 R 22,497,672 R 54,826,185 Current Fee Change Fee Change Fee Change R 1,054,328,559 0.33% 0.55% 1.16% R 242,804,190 0.93% 1.56% 3.29% R 26,240,000 5.40% 9.05% 19.08% Note that these are very rough estimates to try and indicate potential costs. The table above tries to estimate the impact on fees in the tuition and housing operations by splitting out the various contract costs to where they are incurred and paid for. Thus should UCT decide to raise the SLL rate to R5750 (implying a TCTC rate of R7,475 as outlined in SLL 3), tuition fees would need to increase by 1.63% in 2015 in addition to a general fee increase which is in double digits already due to pressures on subsidy (down) and financial aid/NSFAS (up), while fees for housing (excluding meal costs and catering overhead) would need to increase by 3.29% with the costs for catering overheads (charged in catering residences only) would increase by 19.08%. Finance Department View: In light of all the preceding and attached information presented, it would seem appropriate to suggest a 2015 SLL computed on the 2014 SLL increased (as is currently provided for) by the 8 CPI at June 2014. This will result in an SLL of R5018.1600 and an estimated TCTC of R6 500 per month. The cost of this increase has already been incorporated into the fee increase being proposed. If, in considering the DPRU paper with the updated Cost of Basic Needs (CoBN), the minimum 2015 SLL were to be set higher, say at R5,200, the following are the implications (relative to the fee increases proposed by the Univesity Finance Committee that will be before Council on 27 September 2014) A further increase in tuition fees of 0,22% (or a further cut in budgets of R2,3million); A further housing fee increase of 0,63% (or a cut in services to housing of R1,5 million) and A furher increase of 4,65% in the housing catering overhead fee (to raise the additional money to pay the extra R900 000 cost) Any higher SLL (and related TCTC) without significant job losses and reduction in service levels is not affordable, nor sustainable Conclusion: In arriving at a recommended 2015 SLL several approaches were suggested. For reasons expressed in the sections above, the following approaches have little if any relevance: UCT equivalent pay-class salaries – UCT has no staff at these levels. The notional scales that exist on paper are inappropriate as a benchmark. Market comparisons: o Sectoral determinations, some union based wages and wages paid by outsource companies all too low (well below Cost of Basic Needs line). o Other universities – difficult to interpret but probably lower than UCT; o Remchannel data of private sector – very variable, generally higher, some >R8000. Concern about appropriateness and national patterns in relation to other more skilled jobs. Ratio of highest to lowest paid employees: not particularly suited to setting salary levels especially where the markets for the highest are international, and for the lowest local; computationally volatile. In Management’s view, the most useful and appropriate guideline is that derived from the DPRU 2008 assessment poverty lines and the Cost of Basic Needs (CoBN). The data was extrapolated to 2014 indicating an average of the low and high CoBN rates of R4, 014, with the high level rate at R5, 203. The actual SLL rate currently applied is R4, 700 is thus well within the ballpark. For 2015 the average and high-level CoBN rates would be R4274 and R5541 respectively. My Finance colleagues regard anything above R5000* as high risk in terms of sustainability. This is therefore what I am proposing for 2015. It is close to the high level of the CoBN and very much higher than what is generally paid by the market. * The actual amount would be R5, 018.66 – being the 2014 minimum R4, 703.52 increased by the 6.7% June 2014 Quintile 2 rate. Dr M R Price Vice-Chancellor 24 September 2014 . 1 Annexures are not included but are available on request as above 3 as above 2 9

