fund highlights - Thornmark Asset Management
advertisement
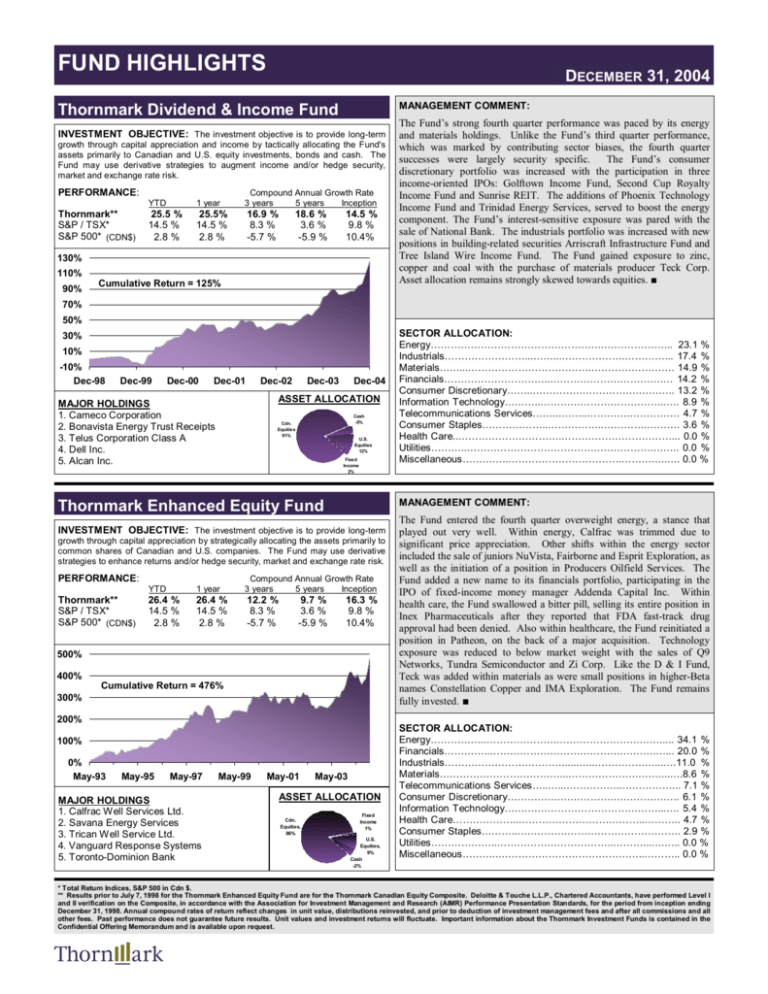
FUND HIGHLIGHTS DECEMBER 31, 2004 Thornmark Dividend & Income Fund MANAGEMENT COMMENT: INVESTMENT OBJECTIVE: The investment objective is to provide long-term growth through capital appreciation and income by tactically allocating the Fund's assets primarily to Canadian and U.S. equity investments, bonds and cash. The Fund may use derivative strategies to augment income and/or hedge security, market and exchange rate risk. PERFORMANCE: Thornmark** S&P / TSX* S&P 500* (CDN$) YTD 1 year Compound Annual Growth Rate 3 years 5 years Inception 25.5 % 14.5 % 2.8 % 25.5% 14.5 % 2.8 % 16.9 % 8.3 % -5.7 % 18.6 % 3.6 % -5.9 % 14.5 % 9.8 % 10.4% 130% 110% 90% Cumulative Return = 125% The Fund’s strong fourth quarter performance was paced by its energy and materials holdings. Unlike the Fund’s third quarter performance, which was marked by contributing sector biases, the fourth quarter successes were largely security specific. The Fund’s consumer discretionary portfolio was increased with the participation in three income-oriented IPOs: Golftown Income Fund, Second Cup Royalty Income Fund and Sunrise REIT. The additions of Phoenix Technology Income Fund and Trinidad Energy Services, served to boost the energy component. The Fund’s interest-sensitive exposure was pared with the sale of National Bank. The industrials portfolio was increased with new positions in building-related securities Arriscraft Infrastructure Fund and Tree Island Wire Income Fund. The Fund gained exposure to zinc, copper and coal with the purchase of materials producer Teck Corp. Asset allocation remains strongly skewed towards equities. ■ 70% 50% 30% 10% -10% Dec-98 Dec-99 Dec-00 Dec-01 Dec-02 Dec-03 Dec-04 ASSET ALLOCATION MAJOR HOLDINGS 1. Cameco Corporation 2. Bonavista Energy Trust Receipts 3. Telus Corporation Class A 4. Dell Inc. 5. Alcan Inc. Cash -5% Cdn. Equitie s 91% U.S. Equities 12% Fixe d Income 2% Thornmark Enhanced Equity Fund MANAGEMENT COMMENT: INVESTMENT OBJECTIVE: The investment objective is to provide long-term growth through capital appreciation by strategically allocating the assets primarily to common shares of Canadian and U.S. companies. The Fund may use derivative strategies to enhance returns and/or hedge security, market and exchange rate risk. PERFORMANCE: Thornmark** S&P / TSX* S&P 500* (CDN$) YTD 1 year Compound Annual Growth Rate 3 years 5 years Inception 26.4 % 14.5 % 2.8 % 26.4 % 14.5 % 2.8 % 12.2 % 8.3 % -5.7 % 9.7 % 3.6 % -5.9 % 16.3 % 9.8 % 10.4% 500% 400% Cumulative Return = 476% 300% 200% 100% 0% May-93 May-95 May-97 MAJOR HOLDINGS 1. Calfrac Well Services Ltd. 2. Savana Energy Services 3. Trican Well Service Ltd. 4. Vanguard Response Systems 5. Toronto-Dominion Bank May-99 May-01 May-03 ASSET ALLOCATION Cdn. Equities, 86% SECTOR ALLOCATION: Energy…………………………………………….………………... 23.1 % Industrials……………………...……...……………….…………... 17.4 % Materials……...……………………………….……………………. 14.9 % Financials…………………………..…………………………….… 14.2 % Consumer Discretionary……..…………….…………….……….. 13.2 % Information Technology………..………………………………..…. 8.9 % Telecommunications Services……..……...………….…………… 4.7 % Consumer Staples………………..……………..………….………. 3.6 % Health Care..………………………….……………………………... 0.0 % Utilities………..………………………………….…………….…….. 0.0 % Miscellaneous…………..…………………………….…………..…. 0.0 % Fixed Income 1% U.S. Equities, 9% Cash -2% The Fund entered the fourth quarter overweight energy, a stance that played out very well. Within energy, Calfrac was trimmed due to significant price appreciation. Other shifts within the energy sector included the sale of juniors NuVista, Fairborne and Esprit Exploration, as well as the initiation of a position in Producers Oilfield Services. The Fund added a new name to its financials portfolio, participating in the IPO of fixed-income money manager Addenda Capital Inc. Within health care, the Fund swallowed a bitter pill, selling its entire position in Inex Pharmaceuticals after they reported that FDA fast-track drug approval had been denied. Also within healthcare, the Fund reinitiated a position in Patheon, on the back of a major acquisition. Technology exposure was reduced to below market weight with the sales of Q9 Networks, Tundra Semiconductor and Zi Corp. Like the D & I Fund, Teck was added within materials as were small positions in higher-Beta names Constellation Copper and IMA Exploration. The Fund remains fully invested. ■ SECTOR ALLOCATION: Energy……………..………………….…………………….…….... 34.1 % Financials…………..………………………………….……….…... 20.0 % Industrials………………………………....…...………………...….11.0 % Materials………………………………...………………….……...….8.6 % Telecommunications Services…..…...……………..……………... 7.1 % Consumer Discretionary…………….…………….……………….. 6.1 % Information Technology…….…………………………………...…. 5.4 % Health Care………………..………………………………..……….. 4.7 % Consumer Staples………..…………………………………………. 2.9 % Utilities………………..……………………………..………...….….. 0.0 % Miscellaneous………..……………………………………..……….. 0.0 % * Total Return Indices, S&P 500 in Cdn $. ** Results prior to July 7, 1998 for the Thornmark Enhanced Equity Fund are for the Thornmark Canadian Equity Composite. Deloitte & Touche L.L.P., Chartered Accountants, have performed Level I and II verification on the Composite, in accordance with the Association for Investment Management and Research (AIMR) Performance Presentation Standards, for the period from inception ending December 31, 1998. Annual compound rates of return reflect changes in unit value, distributions reinvested, and prior to deduction of investment management fees and after all commissions and all other fees. Past performance does not guarantee future results. Unit values and investment returns will fluctuate. Important information about the Thornmark Investment Funds is contained in the Confidential Offering Memorandum and is available upon request.

