Portfolio analZtics
advertisement
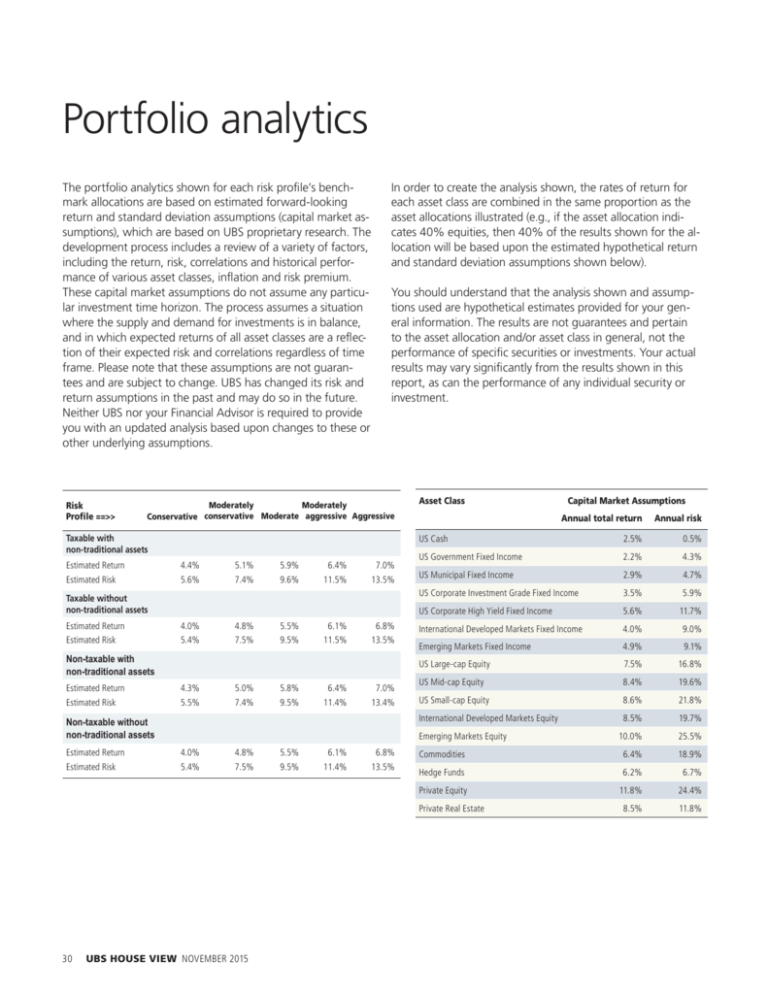
1PSUGPMJPBOBMZUJDT 5IFQPSUGPMJPBOBMZUJDTTIPXOGPSFBDISJTLQSPŖMFÁTCFODImark allocations are based on estimated forward-looking return and standard deviation assumptions (capital market assumptions), which are based on UBS proprietary research. The development process includes a review of a variety of factors, including the return, risk, correlations and historical perforNBODFPGWBSJPVTBTTFUDMBTTFTJOŗBUJPOBOESJTLQSFNJVN These capital market assumptions do not assume any particular investment time horizon. The process assumes a situation where the supply and demand for investments is in balance, BOEJOXIJDIFYQFDUFESFUVSOTPGBMMBTTFUDMBTTFTBSFBSFŗFDtion of their expected risk and correlations regardless of time GSBNF1MFBTFOPUFUIBUUIFTFBTTVNQUJPOTBSFOPUHVBSBOtees and are subject to change. UBS has changed its risk and return assumptions in the past and may do so in the future. Neither UBS nor your Financial Advisor is required to provide you with an updated analysis based upon changes to these or other underlying assumptions. In order to create the analysis shown, the rates of return for each asset class are combined in the same proportion as the asset allocations illustrated (e.g., if the asset allocation indicates 40% equities, then 40% of the results shown for the allocation will be based upon the estimated hypothetical return and standard deviation assumptions shown below). You should understand that the analysis shown and assumptions used are hypothetical estimates provided for your general information. The results are not guarantees and pertain to the asset allocation and/or asset class in general, not the QFSGPSNBODFPGTQFDJŖDTFDVSJUJFTPSJOWFTUNFOUT:PVSBDUVBM SFTVMUTNBZWBSZTJHOJŖDBOUMZGSPNUIFSFTVMUTTIPXOJOUIJT report, as can the performance of any individual security or investment. Moderately Moderately Risk 1SPlMFConservative conservative Moderate aggressive Aggressive Taxable with non-traditional assets Estimated Return 4.4% 5.1% 5.9% 6.4% 7.0% Estimated Risk 5.6% 7.4% 9.6% 11.5% 13.5% Taxable without non-traditional assets Estimated Return 4.0% 4.8% 5.5% 6.1% 6.8% Estimated Risk 5.4% 7.5% 9.5% 11.5% 13.5% Non-taxable with non-traditional assets Estimated Return 4.3% 5.0% 5.8% 6.4% 7.0% Estimated Risk 5.5% 7.4% 9.5% 11.4% 13.4% Non-taxable without non-traditional assets Asset Class 4.0% 4.8% 5.5% 6.1% 6.8% Estimated Risk 5.4% 7.5% 9.5% 11.4% 13.5% 2.5% 0.5% US Government Fixed Income 2.2% 4.3% US Municipal Fixed Income 2.9% 4.7% US Corporate Investment Grade Fixed Income 3.5% 5.9% US Corporate High Yield Fixed Income 5.6% 11.7% International Developed Markets Fixed Income 4.0% 9.0% Emerging Markets Fixed Income 4.9% 9.1% US Large-cap Equity 7.5% 16.8% US Mid-cap Equity 8.4% 19.6% US Small-cap Equity 8.6% 21.8% International Developed Markets Equity 8.5% 19.7% 10.0% 25.5% Commodities 6.4% 18.9% Hedge Funds 6.2% 6.7% Private Equity 11.8% 24.4% 8.5% 11.8% Private Real Estate 30 UBS HOUSE VIEW NOVEMBER 2015 Annual risk US Cash Emerging Markets Equity Estimated Return Capital Market Assumptions Annual total return

