World Population Growth
advertisement
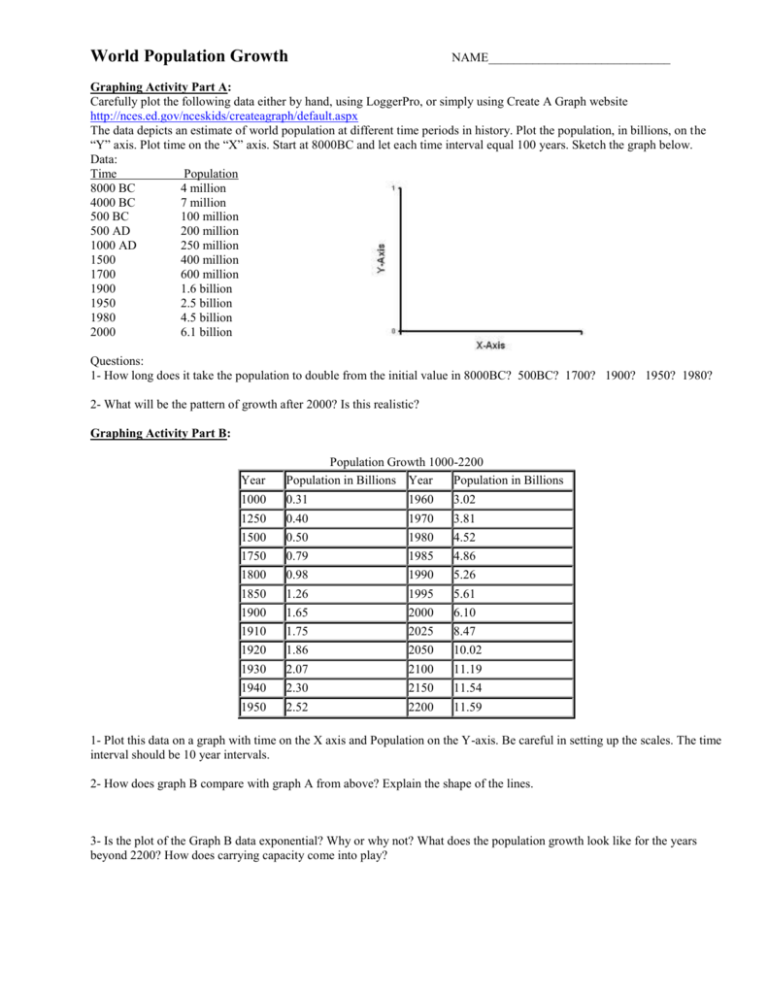
World Population Growth NAME_____________________________ Graphing Activity Part A: Carefully plot the following data either by hand, using LoggerPro, or simply using Create A Graph website http://nces.ed.gov/nceskids/createagraph/default.aspx The data depicts an estimate of world population at different time periods in history. Plot the population, in billions, on the “Y” axis. Plot time on the “X” axis. Start at 8000BC and let each time interval equal 100 years. Sketch the graph below. Data: Time Population 8000 BC 4 million 4000 BC 7 million 500 BC 100 million 500 AD 200 million 1000 AD 250 million 1500 400 million 1700 600 million 1900 1.6 billion 1950 2.5 billion 1980 4.5 billion 2000 6.1 billion Questions: 1- How long does it take the population to double from the initial value in 8000BC? 500BC? 1700? 1900? 1950? 1980? 2- What will be the pattern of growth after 2000? Is this realistic? Graphing Activity Part B: Year Population Growth 1000-2200 Population in Billions Year Population in Billions 1000 0.31 1960 3.02 1250 0.40 1970 3.81 1500 0.50 1980 4.52 1750 0.79 1985 4.86 1800 0.98 1990 5.26 1850 1.26 1995 5.61 1900 1.65 2000 6.10 1910 1.75 2025 8.47 1920 1.86 2050 10.02 1930 2.07 2100 11.19 1940 2.30 2150 11.54 1950 2.52 2200 11.59 1- Plot this data on a graph with time on the X axis and Population on the Y-axis. Be careful in setting up the scales. The time interval should be 10 year intervals. 2- How does graph B compare with graph A from above? Explain the shape of the lines. 3- Is the plot of the Graph B data exponential? Why or why not? What does the population growth look like for the years beyond 2200? How does carrying capacity come into play?

