World Population Growth Graph
advertisement
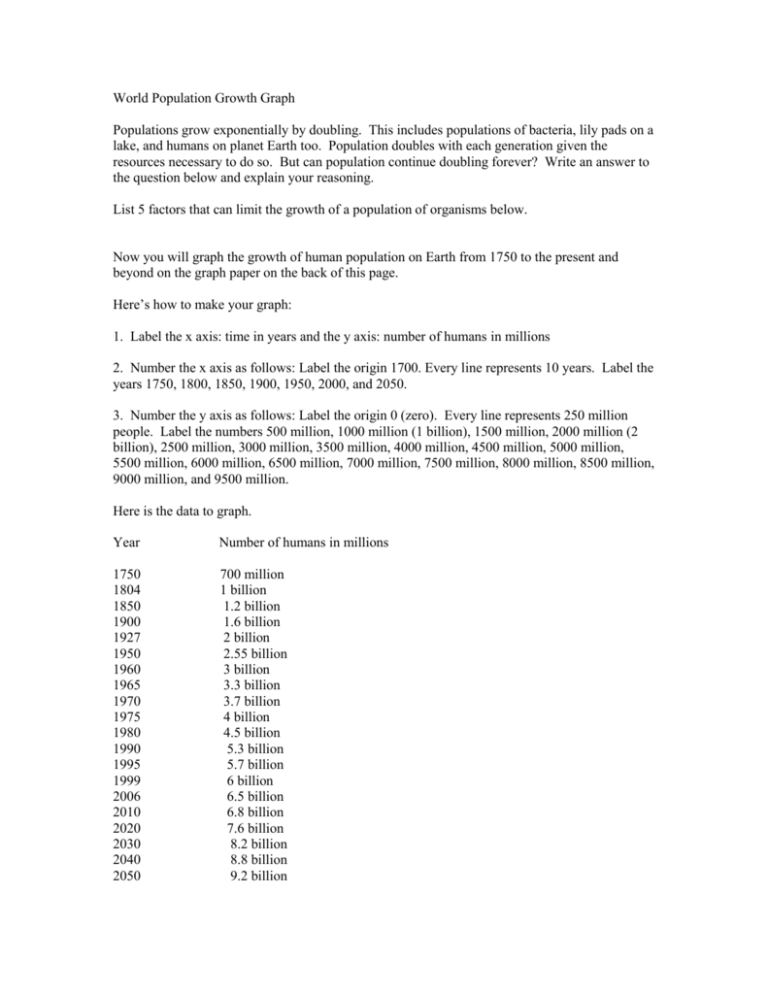
World Population Growth Graph Populations grow exponentially by doubling. This includes populations of bacteria, lily pads on a lake, and humans on planet Earth too. Population doubles with each generation given the resources necessary to do so. But can population continue doubling forever? Write an answer to the question below and explain your reasoning. List 5 factors that can limit the growth of a population of organisms below. Now you will graph the growth of human population on Earth from 1750 to the present and beyond on the graph paper on the back of this page. Here’s how to make your graph: 1. Label the x axis: time in years and the y axis: number of humans in millions 2. Number the x axis as follows: Label the origin 1700. Every line represents 10 years. Label the years 1750, 1800, 1850, 1900, 1950, 2000, and 2050. 3. Number the y axis as follows: Label the origin 0 (zero). Every line represents 250 million people. Label the numbers 500 million, 1000 million (1 billion), 1500 million, 2000 million (2 billion), 2500 million, 3000 million, 3500 million, 4000 million, 4500 million, 5000 million, 5500 million, 6000 million, 6500 million, 7000 million, 7500 million, 8000 million, 8500 million, 9000 million, and 9500 million. Here is the data to graph. Year Number of humans in millions 1750 1804 1850 1900 1927 1950 1960 1965 1970 1975 1980 1990 1995 1999 2006 2010 2020 2030 2040 2050 700 million 1 billion 1.2 billion 1.6 billion 2 billion 2.55 billion 3 billion 3.3 billion 3.7 billion 4 billion 4.5 billion 5.3 billion 5.7 billion 6 billion 6.5 billion 6.8 billion 7.6 billion 8.2 billion 8.8 billion 9.2 billion
