In this file, I have listed some examples of output from Minitab. You
advertisement
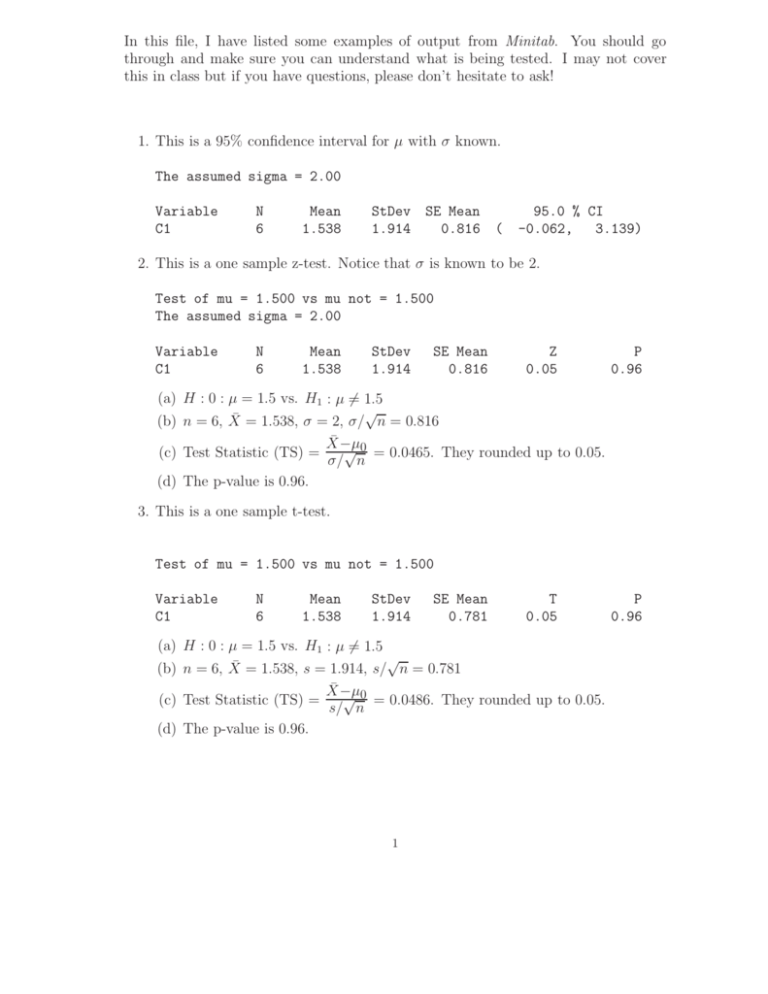
In this file, I have listed some examples of output from Minitab. You should go through and make sure you can understand what is being tested. I may not cover this in class but if you have questions, please don’t hesitate to ask! 1. This is a 95% confidence interval for µ with σ known. The assumed sigma = 2.00 Variable C1 N 6 Mean 1.538 StDev SE Mean 1.914 0.816 ( 95.0 % CI -0.062, 3.139) 2. This is a one sample z-test. Notice that σ is known to be 2. Test of mu = 1.500 vs mu not = 1.500 The assumed sigma = 2.00 Variable C1 N 6 Mean 1.538 StDev 1.914 SE Mean 0.816 Z 0.05 P 0.96 (a) H : 0 : µ = 1.5 vs. H1 : µ 6= 1.5 √ (b) n = 6, X̄ = 1.538, σ = 2, σ/ n = 0.816 X̄ −µ √ 0 = 0.0465. They rounded up to 0.05. (c) Test Statistic (TS) = σ/ n (d) The p-value is 0.96. 3. This is a one sample t-test. Test of mu = 1.500 vs mu not = 1.500 Variable C1 N 6 Mean 1.538 StDev 1.914 (a) H : 0 : µ = 1.5 vs. H1 : µ 6= 1.5 SE Mean 0.781 T 0.05 √ (b) n = 6, X̄ = 1.538, s = 1.914, s/ n = 0.781 X̄ −µ √ 0 = 0.0486. They rounded up to 0.05. (c) Test Statistic (TS) = s/ n (d) The p-value is 0.96. 1 P 0.96 4. This is a one sample t-test. Notice how they don’t make H0 and H1 opposites. H1 determines what you’re testing! Test of mu = 1.500 vs mu < 1.500 Variable C1 N 6 Mean 1.538 StDev 1.914 SE Mean 0.781 T 0.05 P 0.52 (a) H : 0 : µ = 1.5(≥) vs. H1 : µ < 1.5 √ (b) n = 6, X̄ = 1.538, s = 1.914, s/ n = 0.781 X̄ −µ √ 0 = 0.0486. They rounded up to 0.05. (c) Test Statistic (TS) = s/ n (d) The p-value is 0.52. 5. This is a one sample test of proportion. Test of p = 0.2 vs p > 0.2 Sample 1 X 1024 N 4860 Sample p 95.0 % CI Z-Value P-Value 0.210700 (0.199234, 0.222165) 1.86 0.031 (a) H : 0 : p = 0.2(≤) vs. H1 : p > 0.2. p0 = 0.2 (b) n = 4660, p̂ = 1024/4860 = 0.2107. A 95% confidence interval for p is given. p̂−p0 (c) Test Statistic (TS) = r = 1.86. p0 (1−p0 ) n (d) The p-value is 0.031. 6. This is a test of 2 proportions. Sample 1 2 X 101 56 N Sample p 10239 0.009864 9877 0.005670 Estimate for p(1) - p(2): 0.00419451 95% CI for p(1) - p(2): (0.00177439, 0.00661463) Test for p(1) - p(2) = 0 (vs not = 0): Z = 3.40 P-Value = 0.001 (a) H : 0 : p1 = p2 (≤) vs. H1 : p1 6= p2 . (b) Test Statistic (TS) = 3.40 (c) The p-value is 0.001. 7. This is a two sample test of means. A two-sample t-test was used. Two sample T for C1 vs C2 C1 C2 N 21 8 Mean 13.29 24.00 StDev 3.74 1.69 SE Mean 0.82 0.60 95% CI for mu C1 - mu C2: ( -12.80, -8.63) T-Test mu C1 = mu C2 (vs not =): T = -10.59 P = 0.0000 DF = 25 (a) H : 0 : µ1 = µ2 vs. H1 : µ1 6= µ2 . (b) They give the summary information: sample sizes, sample means, sample standard deviations, sample standard errors. X̄1 −X̄2 √ 13.29−24 (c) Test Statistic (TS) = v = -10.59. (I get -10.54 = u 2 u s2 0.822 +0.602 s t 1 2 n1 + n2 when I use this formula. I suspect they rounded the standard errors above.) (d) The p-value is reported as 0.0000.

