Supplementary Table S1 (docx 14K)
advertisement
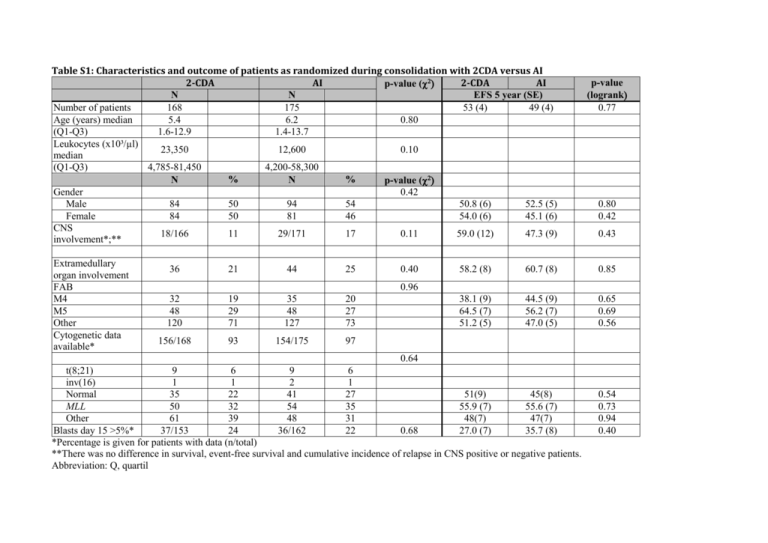
Table S1: Characteristics and outcome of patients as randomized during consolidation with 2CDA versus AI 2-CDA AI 2-CDA AI p-value ( N N EFS 5 year (SE) Number of patients 168 175 53 (4) 49 (4) Age (years) median 5.4 6.2 0.80 (Q1-Q3) 1.6-12.9 1.4-13.7 Leukocytes (x10³/µl) 23,350 12,600 0.10 median (Q1-Q3) 4,785-81,450 4,200-58,300 % % N N p-value ( Gender 0.42 Male 84 50 94 54 50.8 (6) 52.5 (5) Female 84 50 81 46 54.0 (6) 45.1 (6) CNS 18/166 11 29/171 17 0.11 59.0 (12) 47.3 (9) involvement*;** Extramedullary organ involvement FAB M4 M5 Other Cytogenetic data available* 36 21 44 25 32 48 120 19 29 71 35 48 127 20 27 73 156/168 93 154/175 97 0.40 p-value (logrank 0.77 0.80 0.42 0.43 58.2 (8) 60.7 (8) 0.85 38.1 (9) 64.5 (7) 51.2 (5) 44.5 (9) 56.2 (7) 47.0 (5) 0.65 0.69 0.56 0.96 0.64 t(8;21) 9 6 9 6 inv(16) 1 1 2 1 Normal 35 22 41 27 51(9) 45(8) MLL 50 32 54 35 55.9 (7) 55.6 (7) Other 61 39 48 31 48(7) 47(7) Blasts day 15 >5%* 37/153 24 36/162 22 0.68 27.0 (7) 35.7 (8) *Percentage is given for patients with data (n/total) **There was no difference in survival, event-free survival and cumulative incidence of relapse in CNS positive or negative patients. Abbreviation: Q, quartil 0.54 0.73 0.94 0.40
