Solution_HW11
advertisement
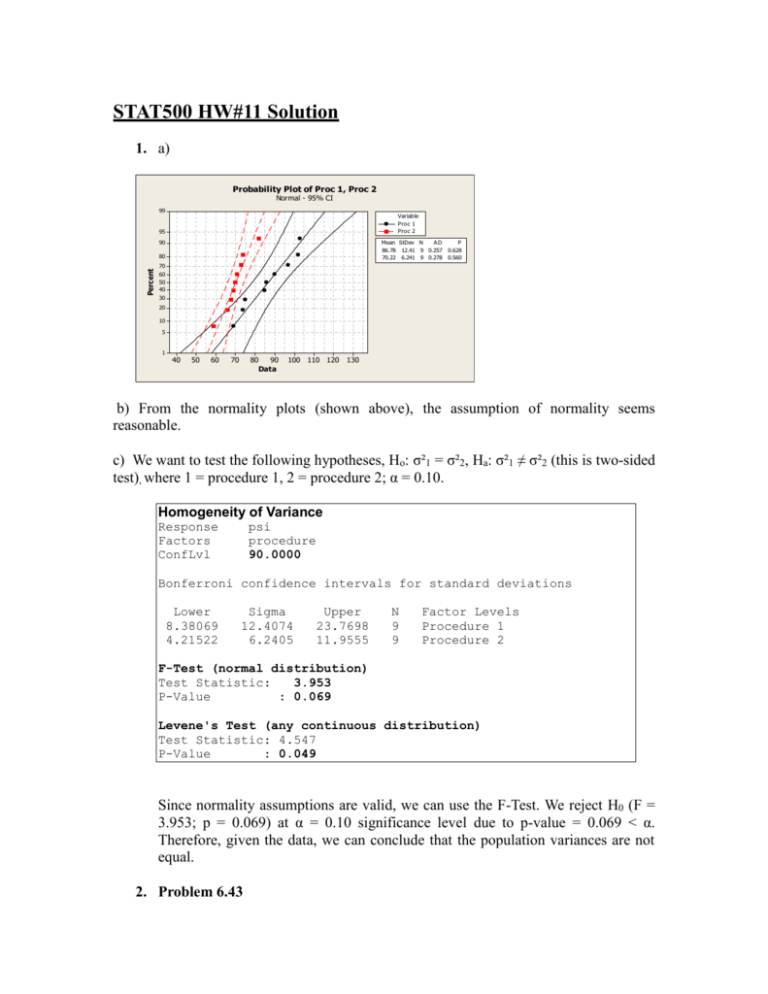
STAT500 HW#11 Solution 1. a) Probability Plot of Proc 1, Proc 2 Normal - 95% CI 99 Variable Proc 1 Proc 2 95 90 Mean StDev N AD 86.78 12.41 9 0.257 70.22 6.241 9 0.278 Percent 80 P 0.628 0.560 70 60 50 40 30 20 10 5 1 40 50 60 70 80 90 Data 100 110 120 130 b) From the normality plots (shown above), the assumption of normality seems reasonable. c) We want to test the following hypotheses, Ho: σ²1 = σ²2, Ha: σ²1 ≠ σ²2 (this is two-sided test), where 1 = procedure 1, 2 = procedure 2; α = 0.10. Homogeneity of Variance Response Factors ConfLvl psi procedure 90.0000 Bonferroni confidence intervals for standard deviations Lower 8.38069 4.21522 Sigma 12.4074 6.2405 Upper 23.7698 11.9555 N 9 9 Factor Levels Procedure 1 Procedure 2 F-Test (normal distribution) Test Statistic: 3.953 P-Value : 0.069 Levene's Test (any continuous distribution) Test Statistic: 4.547 P-Value : 0.049 Since normality assumptions are valid, we can use the F-Test. We reject H0 (F = 3.953; p = 0.069) at α = 0.10 significance level due to p-value = 0.069 < α. Therefore, given the data, we can conclude that the population variances are not equal. 2. Problem 6.43 (a) The data are not paired. Need to determine whether to use pooled variance or separate variance. Also both n1 and n2 are less than 30. So need to check normality assumption for both sets. Probability Plot of Wide-body, Narrow-body Normal - 95% CI 99 Variable Wide-body Narrow-body 95 90 Mean StDev N AD P 110.2 4.714 15 0.420 0.283 118.4 7.866 12 0.275 0.593 Percent 80 70 60 50 40 30 20 10 5 1 90 100 110 120 Data 130 140 150 Normality assumptions in both cases are satisfied. Thus F-test can be applied to test the equality of variances. Test for Equal Variances: C1, C2 95% Bonferroni confidence intervals for standard deviations C1 C2 N 15 12 Lower 3.30876 5.31926 StDev 4.71442 7.86619 Upper 7.9907 14.5407 F-Test (Normal Distribution) Test statistic = 0.36, p-value = 0.075 Levene's Test (Any Continuous Distribution) Test statistic = 3.36, p-value = 0.079 From the output, we have p-value=0.075 > 0.05, and thus conclude that there’s no significance difference between the variances of the two areas. Pooled StDev can be applied. [Note that here the Rule of Thumb that we followed for HW 10 led us to use separate variances] Two-Sample T-Test and CI: C1, C2 Two-sample T for C1 vs C2 C1 C2 N 15 12 Mean 110.20 118.37 StDev 4.71 7.87 SE Mean 1.2 2.3 Difference = mu (C1) - mu (C2) Estimate for difference: -8.17 95% CI for difference: (-13.19, -3.14) T-Test of difference = 0 (vs not =): T-Value = -3.35 P-Value = 0.003 DF = 25 Both use Pooled StDev = 6.2986 From the output, P-value = 0.003 < 0.05, indicating that we can reject the null hypotheses of mean noise level being equal and conclude that narrow-body jets have a higher noise level. (b) 95% confidence interval of the difference between the two noise levels is (-13.19, -3.14) [Naturally the c.i. is also different from what we got in HW10] 3. Problem 10.65 Ho: The opinion is independent of membership status Ha: The opinion is dependent of membership status Chi-Square Test: Favor, Indifferent, Opposed Expected counts are printed below observed counts Chi-Square contributions are printed below expected counts Favor 140 70.00 70.000 Indifferent 42 80.00 18.050 Opposed 18 50.00 20.480 Total 200 2 70 140.00 35.000 198 160.00 9.025 132 100.00 10.240 400 Total 210 240 150 600 1 Chi-Sq = 162.795, DF = 2, P-Value = 0.000 Reject the independence hypothesis (p-value<0.01). We can conclude that the opinion is dependent of membership status (not independent). The evidence is strong since the pvalue is 0.000, very small. 4. χ2 = 2 3 [(nij – Eij)2/Eij] i 1 j 1 =(140-70)2/70 + (42-80)2/80 + (18-50)2/(50) + (70-140)2/(140) + (198-160)2/(160) + (132-100)2/(100) = 70 + 18.05 + 20.48 + 35 + 9.025 + 10.24 = 162.795 df = (3-1) (2-1) = 2 5. Social status Middle working Total A few 7( 7.397 ) 8( 7.603 ) 15 some lots 13( 11.836 ) 16(16.767 ) 11( 12.164 ) 18( 17.233) 24 34 Total 36 37 73 Expected counts are printed below observed counts Chi-Square contributions are printed below expected counts A few 7 7.40 0.021 Some 13 11.84 0.115 Lots 16 16.77 0.035 Total 36 2 8 7.60 0.021 11 12.16 0.111 18 17.23 0.034 37 Total 15 24 34 73 1 Chi-Sq = 0.337, DF = 2, P-Value = 0.845 Conclusion: At α = 0.05, fail to reject H0 (P-value=0.845). There is not sufficient sample evidence to reject that nursery-rhyme knowledge and social status are independent.
