Chap13_Examples
advertisement
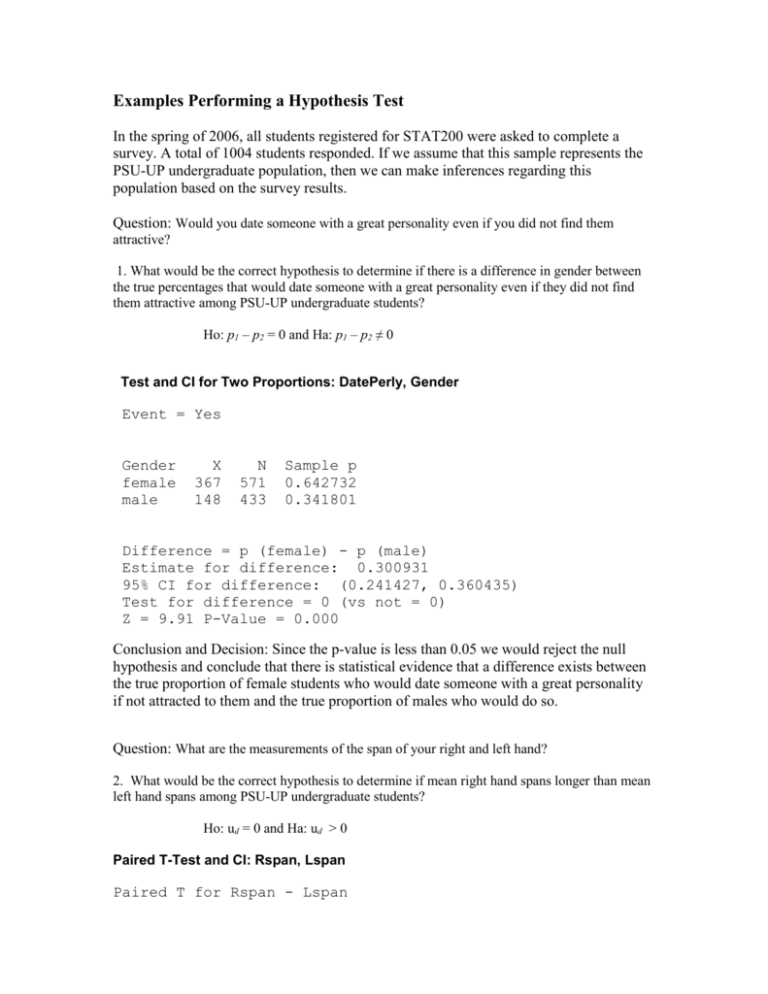
Examples Performing a Hypothesis Test In the spring of 2006, all students registered for STAT200 were asked to complete a survey. A total of 1004 students responded. If we assume that this sample represents the PSU-UP undergraduate population, then we can make inferences regarding this population based on the survey results. Question: Would you date someone with a great personality even if you did not find them attractive? 1. What would be the correct hypothesis to determine if there is a difference in gender between the true percentages that would date someone with a great personality even if they did not find them attractive among PSU-UP undergraduate students? Ho: p1 – p2 = 0 and Ha: p1 – p2 ≠ 0 Test and CI for Two Proportions: DatePerly, Gender Event = Yes Gender female male X 367 148 N 571 433 Sample p 0.642732 0.341801 Difference = p (female) - p (male) Estimate for difference: 0.300931 95% CI for difference: (0.241427, 0.360435) Test for difference = 0 (vs not = 0) Z = 9.91 P-Value = 0.000 Conclusion and Decision: Since the p-value is less than 0.05 we would reject the null hypothesis and conclude that there is statistical evidence that a difference exists between the true proportion of female students who would date someone with a great personality if not attracted to them and the true proportion of males who would do so. Question: What are the measurements of the span of your right and left hand? 2. What would be the correct hypothesis to determine if mean right hand spans longer than mean left hand spans among PSU-UP undergraduate students? Ho: ud = 0 and Ha: ud > 0 Paired T-Test and CI: Rspan, Lspan Paired T for Rspan - Lspan Rspan Lspan Difference N 922 922 922 Mean 20.6837 20.6355 0.048134 StDev 2.3194 2.3332 0.798840 SE Mean 0.0764 0.0768 0.026308 95% CI for mean difference: (-0.003497, 0.099766) T-Test of mean difference = 0 (vs not = 0): T-Value = 1.83 P-Value = 0.068 Conclusion and Decision: Since the p-value is less than 0.05 but is for a two-sided test (note that minitab says “not = 0”), and thus with our Ha using > we need to divide this pvalue by 2. That results in a p-value of 0.034 meaning we would reject the null hypothesis and conclude that there is statistical evidence that, on average, the true mean length of right hand spans is greater than the true mean length of left hand spans for PSUUP undergrads. Question: About how many days per month do you drink alcohol? 3. Some students who belong to Greek organizations believe that they do not drink anymore than non-greek students. However, the university administration does not agree, and think that the greek population drinks more often than their non-greek counterparts. What would be the correct hypothesis to determine if the administration is correct? Assume that non-greeks are population u1 and greeks are u2. Ho: u1 – u2 = 0 and Ha: u1 – u2 < 0 Two-Sample T-Test and CI: DaysAlco, Greek? Two-sample T for DaysAlco Greek? No Yes N 806 191 Mean 7.29 11.01 StDev 5.52 4.58 SE Mean 0.19 0.33 Difference = mu (No) - mu (Yes) Estimate for difference: -3.71243 95% CI for difference: (-4.55847, -2.86639) T-Test of difference = 0 (vs not =): T-Value = -8.61 P-Value = 0.000 DF = 995 Both use Pooled StDev = 5.3574 Conclusion and Decision: Since the p-value is less than 0.05 but is for a two-sided test (note that minitab says “not = 0”), and thus with our Ha using < we need to divide this pvalue by 2. This results in a p-value of approximately 0.00 meaning we would reject the null hypothesis and conclude that there is statistical evidence that on average, the greek population drinks more days per month than the non-greeks at PSU-UP.


