503_1_S
advertisement
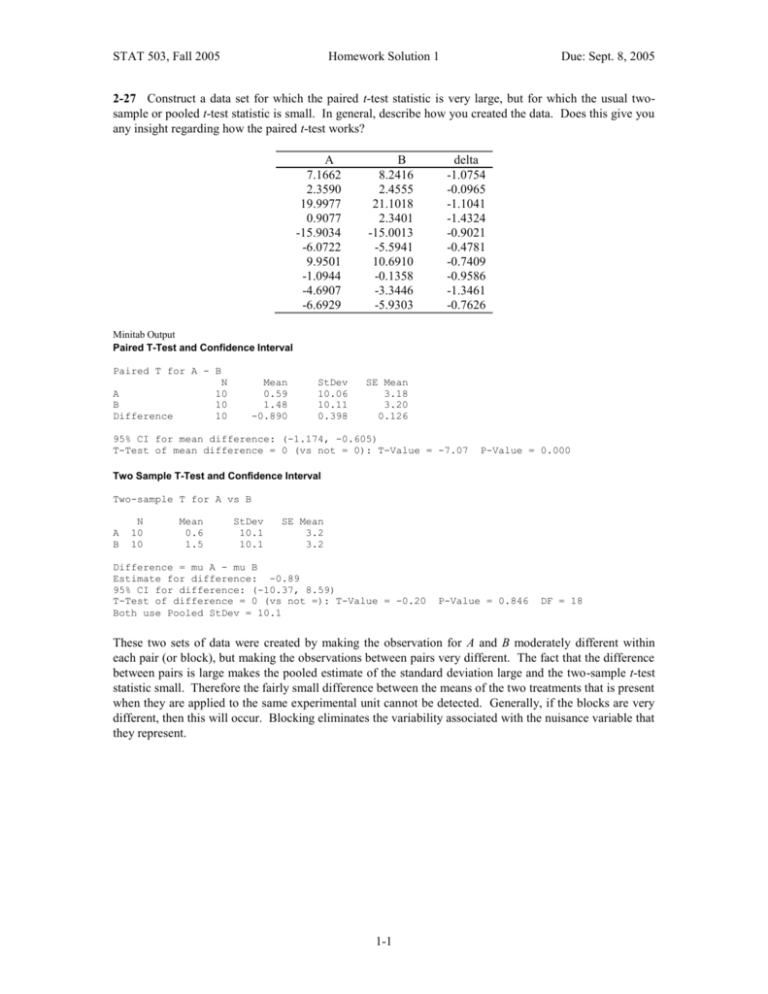
STAT 503, Fall 2005 Homework Solution 1 Due: Sept. 8, 2005 2-27 Construct a data set for which the paired t-test statistic is very large, but for which the usual twosample or pooled t-test statistic is small. In general, describe how you created the data. Does this give you any insight regarding how the paired t-test works? A 7.1662 2.3590 19.9977 0.9077 -15.9034 -6.0722 9.9501 -1.0944 -4.6907 -6.6929 B 8.2416 2.4555 21.1018 2.3401 -15.0013 -5.5941 10.6910 -0.1358 -3.3446 -5.9303 delta -1.0754 -0.0965 -1.1041 -1.4324 -0.9021 -0.4781 -0.7409 -0.9586 -1.3461 -0.7626 Minitab Output Paired T-Test and Confidence Interval Paired T for A - B N A 10 B 10 Difference 10 Mean 0.59 1.48 -0.890 StDev 10.06 10.11 0.398 SE Mean 3.18 3.20 0.126 95% CI for mean difference: (-1.174, -0.605) T-Test of mean difference = 0 (vs not = 0): T-Value = -7.07 P-Value = 0.000 Two Sample T-Test and Confidence Interval Two-sample T for A vs B A B N 10 10 Mean 0.6 1.5 StDev 10.1 10.1 SE Mean 3.2 3.2 Difference = mu A - mu B Estimate for difference: -0.89 95% CI for difference: (-10.37, 8.59) T-Test of difference = 0 (vs not =): T-Value = -0.20 Both use Pooled StDev = 10.1 P-Value = 0.846 DF = 18 These two sets of data were created by making the observation for A and B moderately different within each pair (or block), but making the observations between pairs very different. The fact that the difference between pairs is large makes the pooled estimate of the standard deviation large and the two-sample t-test statistic small. Therefore the fairly small difference between the means of the two treatments that is present when they are applied to the same experimental unit cannot be detected. Generally, if the blocks are very different, then this will occur. Blocking eliminates the variability associated with the nuisance variable that they represent. 1-1

