From Personal Income to Taxable Income, 1950-2004
advertisement
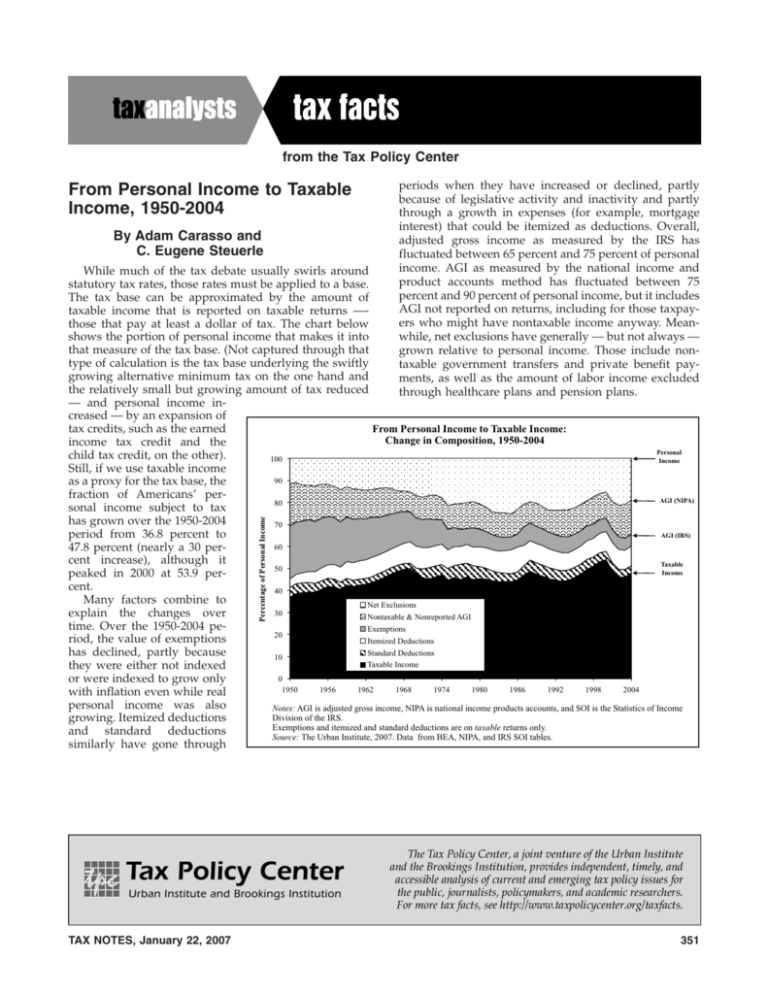
from the Tax Policy Center From Personal Income to Taxable Income, 1950-2004 By Adam Carasso and C. Eugene Steuerle periods when they have increased or declined, partly because of legislative activity and inactivity and partly through a growth in expenses (for example, mortgage interest) that could be itemized as deductions. Overall, adjusted gross income as measured by the IRS has fluctuated between 65 percent and 75 percent of personal income. AGI as measured by the national income and product accounts method has fluctuated between 75 percent and 90 percent of personal income, but it includes AGI not reported on returns, including for those taxpayers who might have nontaxable income anyway. Meanwhile, net exclusions have generally — but not always — grown relative to personal income. Those include nontaxable government transfers and private benefit payments, as well as the amount of labor income excluded through healthcare plans and pension plans. Percentage of Personal Income While much of the tax debate usually swirls around statutory tax rates, those rates must be applied to a base. The tax base can be approximated by the amount of taxable income that is reported on taxable returns —those that pay at least a dollar of tax. The chart below shows the portion of personal income that makes it into that measure of the tax base. (Not captured through that type of calculation is the tax base underlying the swiftly growing alternative minimum tax on the one hand and the relatively small but growing amount of tax reduced — and personal income increased — by an expansion of From Personal Income to Taxable Income: tax credits, such as the earned Change in Composition, 1950-2004 income tax credit and the Personal child tax credit, on the other). 100 Income Still, if we use taxable income 90 as a proxy for the tax base, the fraction of Americans’ perAGI (NIPA) 80 sonal income subject to tax has grown over the 1950-2004 70 period from 36.8 percent to AGI (IRS) 60 47.8 percent (nearly a 30 percent increase), although it Taxable 50 Income peaked in 2000 at 53.9 percent. 40 Many factors combine to Net Exclusions 30 explain the changes over Nontaxable & Nonreported AGI time. Over the 1950-2004 peExemptions 20 riod, the value of exemptions Itemized Deductions Standard Deductions has declined, partly because 10 Taxable Income they were either not indexed 0 or were indexed to grow only 1950 1956 1962 1968 1974 1980 1986 1992 1998 2004 with inflation even while real personal income was also Notes: AGI is adjusted gross income, NIPA is national income products accounts, and SOI is the Statistics of Income Division of the IRS. growing. Itemized deductions Exemptions and itemized and standard deductions are on taxable returns only. and standard deductions Source: The Urban Institute, 2007. Data from BEA, NIPA, and IRS SOI tables. similarly have gone through TAX NOTES, January 22, 2007 351

