chapter 9
advertisement

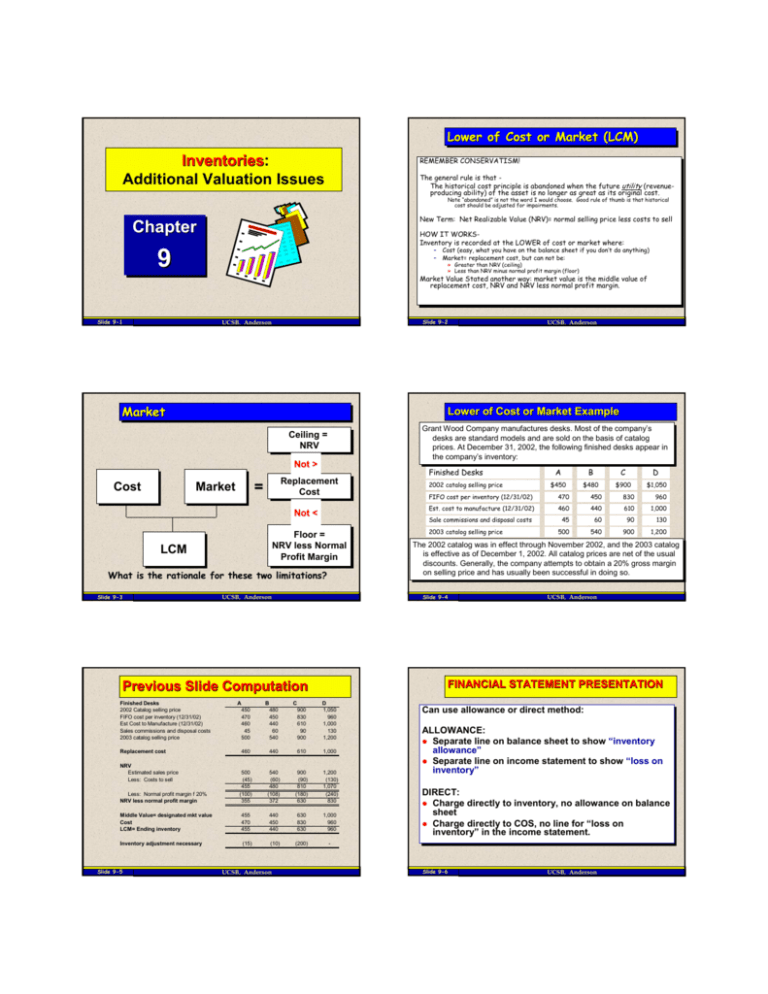
Lower Lower of of Cost Cost or or Market Market (LCM) (LCM) Inventories: Inventories Additional Valuation Issues REMEMBER REMEMBERCONSERVATISM! CONSERVATISM! The Thegeneral generalrule ruleisisthat that-The Thehistorical historicalcost costprinciple principleisisabandoned abandonedwhen whenthe thefuture futureutility utility(revenue(revenueproducing ability) producing ability)of ofthe theasset assetisisno nolonger longeras asgreat greatas asits itsoriginal originalcost. cost. Note Note“abandoned” “abandoned”isisnot notthe theword wordIIwould wouldchoose. choose. Good Goodrule ruleof ofthumb thumbisisthat thathistorical historical cost costshould shouldbe beadjusted adjustedfor forimpairments. impairments. New NewTerm: Term: Net NetRealizable RealizableValue Value(NRV)= (NRV)=normal normalselling sellingprice priceless lesscosts coststo tosell sell Chapter Chapter HOW HOWIT ITWORKSWORKSInventory Inventoryisisrecorded recordedat atthe theLOWER LOWERof ofcost costor ormarket marketwhere: where: –– Cost Cost(easy, (easy,what whatyou youhave haveon onthe thebalance balancesheet sheetififyou youdon’t don’tdo doanything) anything) –– Market= Market=replacement replacementcost, cost,but butcan cannot notbe: be: 9 »» Greater Greaterthan thanNRV NRV(ceiling) (ceiling) »» Less Lessthan thanNRV NRVminus minusnormal normalprofit profitmargin margin(floor) (floor) Market MarketValue ValueStated Statedanother anotherway: way:market marketvalue valueisisthe themiddle middlevalue valueof of replacement replacementcost, cost,NRV NRVand andNRV NRVless lessnormal normalprofit profitmargin. margin. Slide 9-1 Slide 9-2 UCSB, Anderson Market Market Lower of Cost or Market Example Ceiling Ceiling == NRV NRV Not > Cost Cost Replacement Replacement Cost Cost = Market Market Not < What is the rationale for these two limitations? Slide 9-3 450 470 460 45 500 480 450 440 60 540 900 830 610 90 900 460 440 610 1,000 500 (45) 455 (100) 355 540 (60) 480 (108) 372 900 (90) 810 (180) 630 1,200 (130) 1,070 (240) 830 Middle Value= designated mkt value Cost LCM= Ending inventory 455 470 455 440 450 440 630 830 630 1,000 960 960 Inventory adjustment necessary (15) (10) (200) - Replacement cost Less: Normal profit margin f 20% NRV less normal profit margin B C UCSB, Anderson 2002 catalog selling price A B C D $450 $480 $900 $1,050 FIFO cost per inventory (12/31/02) 470 450 830 960 Est. cost to manufacture (12/31/02) 460 440 610 1,000 2003 catalog selling price 45 60 90 130 500 540 900 1,200 The The2002 2002catalog catalogwas wasinineffect effectthrough throughNovember November2002, 2002,and andthe the2003 2003catalog catalog isiseffective effectiveas asof ofDecember December1, 1,2002. 2002.All Allcatalog catalogprices pricesare arenet netof ofthe theusual usual discounts. Generally, the company attempts to obtain a 20% gross margin discounts. Generally, the company attempts to obtain a 20% gross margin on selling price and has usually been successful in doing so. on selling price and has usually been successful in doing so. UCSB, Anderson FINANCIAL STATEMENT PRESENTATION D 1,050 960 1,000 130 1,200 NRV Estimated sales price Less: Costs to sell A Finished Desks Slide 9-4 UCSB, Anderson Previous Slide Computation Finished Desks 2002 Catalog selling price FIFO cost per inventory (12/31/02) Est Cost to Manufacture (12/31/02) Sales commissions and disposal costs 2003 catalog selling price Grant GrantWood WoodCompany Companymanufactures manufacturesdesks. desks.Most Mostof ofthe thecompany’s company’s desks desksare arestandard standardmodels modelsand andare aresold soldon onthe thebasis basisof ofcatalog catalog prices. At December 31, 2002, the following finished desks prices. At December 31, 2002, the following finished desksappear appearinin the company’s inventory: the company’s inventory: Sale commissions and disposal costs Floor Floor== NRV NRVless lessNormal Normal Profit Profit Margin Margin LCM LCM Slide 9-5 UCSB, Anderson Can Canuse use allowance allowanceor ordirect direct method: method: ALLOWANCE: ALLOWANCE: Separate Separateline lineon on balance balance sheet sheetto to show show “inventory “inventory allowance” allowance” Separate Separateline lineon onincome incomestatement statement to toshow show “loss “losson on inventory” inventory” DIRECT: DIRECT: Charge Chargedirectly directlyto toinventory, inventory, no noallowance allowanceon onbalance balance sheet sheet Charge directly to COS, no line for “loss on Charge directly to COS, no line for “loss on inventory” inventory” in inthe the income incomestatement. statement. Slide 9-6 UCSB, Anderson ABC Company Income Statement Sales Cost of goods sold Gross profit Operating expenses: Selling General and administrative Total operating expenses Other revenue and expense: Loss on inventory Interest income Total other Income from operations Income tax expense Net income Slide 9-7 Allowance $ 200,000 120,000 80,000 ABC Company Balance Sheet Direct $ 200,000 132,000 68,000 45,000 20,000 65,000 12,000 5,000 (7,000) 8,000 2,400 $ 5,600 45,000 20,000 65,000 $ A llo w a n c e C u r r e n t a s s e ts : C ash A c c o u n ts r e c e iv a b le In v e n to r y L e s s : in v e n to r y a llo w a n c e P r e p a id s T o ta l c u r r e n t a s s e ts UCSB, Anderson Backs Backsinto intoinventory inventoryusing using aarollforward rollforwardand and estimating estimating the the cost costof ofgoods goods sold soldby byreducing reducingsales salesby bythe theprofit. profit. Company has sales of $100,000 and normal Company has sales of $100,000 and normal profit profit margin marginof of 10%, 10%, so sothey theymake makethe thefollowing followingentry: entry: A/R A/R $100,000 $100,000 Sales $100,000 Sales $100,000 COS COS $90,000 $90,000 Inventory Inventory $$90,000 90,000 Slide 9-8 2 0 ,0 0 0 1 ,2 2 8 ,0 0 0 UCSB, Anderson Retail Retail Inventory Inventory Method Method Provides Provides an an estimate estimate of of ending ending inventory inventory without without aa physical physical count. count. Produces Produces estimates estimates that that may may be be acceptable acceptable for for financial financial statement statement (reporting) (reporting) purposes. purposes. UCSB, Anderson Slide 9-10 Retail Retail Inventory Inventory Variations Variations Textbook TextbookIllustrates: Illustrates: LCM LCMMethod Method(conventional (conventionalretail) retail) –– Computes Computescost costratio ratioafter aftermarkups markups(and (andmarkup markupcancellations) cancellations)only only »» More Moreconservative, conservative,excluding excludingmarkdowns markdownsfrom fromratio ratioresults resultsiningreater greaterCOS COS Cost CostMethod Method(average (averagecost) cost) –– Computes Computescost costratio ratioafter afterboth bothmarkups markupsAND ANDmarkdowns markdowns(and (andcancellations cancellationsto toboth) both) »» LESS LESSconservative, conservative,including includingmarkdowns markdownsininratio ratioresults resultsininlower lowerCOS COS Appendix Appendix9A: 9A: LIFO LIFOretail retailat atcost costwith withstable stableprices prices(LIFO (LIFOretail) retail)COVEREDCOVERED-computes computesratio ratio after afterBOTH BOTHM-ups M-upsand andM-downs M-downs $ 1 0 0 ,0 0 0 3 5 0 ,0 0 0 7 5 8 ,0 0 0 Not Notnormally normallyacceptable acceptablefor forfinancial financialreporting reporting purposes, purposes,but butsometimes sometimespractical practicalfor forinterim interim reporting. reporting. Slide 9-9 1 0 0 ,0 0 0 3 5 0 ,0 0 0 7 7 0 ,0 0 0 (1 2 ,0 0 0 ) 2 0 ,0 0 0 1 ,2 2 8 ,0 0 0 5,000 5,000 8,000 2,400 5,600 GROSS PROFIT METHOD $ D ir e c t NOT NOTCOVERED COVEREDAND ANDSTUDENTS STUDENTSNOT NOTRESPONSIBLE RESPONSIBLEFOR FORIN INTHIS THISCLASS: CLASS: LIFO LIFOat atcost costwith withfluctuating fluctuatingprices prices(dollar-value (dollar-valueLIFO LIFOretail) retail) UCSB, Anderson Retail Retail Inventory Inventory Example Example Jared JaredJones JonesInc. Inc.uses usesthe theretail retailinventory inventorymethod methodto toestimate estimateending ending inventory inventoryfor forits itsmonthly monthlyfinancial financialstatements. statements.The Thefollowing followingdata data pertain pertainto toaasingle singledepartment departmentfor forthe themonth monthof ofOctober October2002: 2002: Cost Retail Inventory, October 1, 2002 $52,000 $78,000 Purchases, net 273,000 415,000 Additional markups Markup cancellations 9,000 Markdowns, net 3,600 2,000 380,000 Sales Prepare Prepareaaschedule schedulecomputing computingending endinginventory inventoryusing usingthe the(1) (1) cost, cost,(2) (2)conventional conventional(LCM), (LCM),and and(3) (3)LIFO LIFOretail retailmethods. methods. Slide 9-11 UCSB, Anderson Slide 9-12 UCSB, Anderson SOLUTIONSOLUTION- CONVENTIONAL RETAIL LIFO SOLUTIONSOLUTION- CONVENTIONAL & COST Cost 52,000 273,000 325,000 Beginning Inventory Purchases, net Merchandise available for sale Additional markups Markup cancellations Conventional/ LCM method Ratio Markdowns, net Total before sales Cost method Ratio DEDUCT SALES ENDING INVENTORY AT RETAIL 325,000 (3,600) 496,400 65.0% 65.5% (380,000) 116,400 ENDING inventory using conventional/ LCM method Ending inventory using cost method Slide 9-13 325,000 Retail 78,000 415,000 493,000 9,000 (2,000) 500,000 75,660 76,209 UCSB, Anderson Appraisal Appraisal of of Retail Retail Inventory Inventory Method Method Cost 52,000 Beginning Inventory LIFO OPENING POOL RATIO Purchases Markups Markup cancellations Markdowns, net New inventory LIFO current layer ratio 78,000 67% 273,000 415,000 9,000 (2,000) (3,600) 418,400 65% 273,000 Total including Beg. Inventory Net sales Ending inventory at retail Ending at Retail 116,400 Retail not necessary 496,400 (380,000) 116,400 Layers at retail Ratio Ending at LIFO Cost October 1 78,000 67% 52,000 October 31 38,400 65% 25,055 77,055 ENDING INVENTORY AT LIFO COST Slide 9-14 UCSB, Anderson Inventory Inventory Disclosure Disclosure Method Method permits: permits: the computation the computation of of net net income income without without aa physical physical count count of of inventory inventory aa control control measure measure in in determining determining inventory inventory shortages. shortages. regulation regulation of of quantities quantities of of merchandise merchandise on on hand. hand. information information needed needed for for insurance insurance purposes. purposes. Composition Composition of of manufactured manufactured inventory inventory ....... ....... Slide 9-15 Slide 9-16 UCSB, Anderson OTHER INVENTORY CONCEPTS Relative Relative Sales Sales Value Value Method: Method: Multiple Multiple items items purchased purchased together, together, cost cost is is assigned assigned by by allocating allocating cost cost using using relative relative proportion proportion of of estimated estimated selling selling price. price. Purchase Purchase Commitments: Commitments: Because Because itit is is “executory” “executory” in in nature nature (both (both parties parties have have yet yet to to fulfill fulfill contractual contractual obligation) obligation) no no recordation. recordation. –– Disclosure Disclosurerequired requiredfor for all all commitments; commitments; –– IfIfcommitment commitmentis isdifferent differentthan thancost, cost,then then aaliability liability should be recorded. should be recorded. Slide 9-17 UCSB, Anderson (raw (raw materials, materials, WIP, WIP, and and finished finished goods) goods) Unusual Unusual or or significant significant financing financing arrangement arrangement (related (related party party transactions, transactions, firm firm purchase purchase commitments, commitments, etc.) etc.) Inventory Inventory costing costing methods methods used. used. Consistency Consistency of of costing costing methods methods from from one one period period to to another. another. UCSB, Anderson SPECIAL ITEMS The The following following chart chart will will help help you you remember remember how how to to treat treat certain certain items items when when applying applying the the various various retail retail inventory inventory methods: methods: COST RETAIL Freight costs Purchase returns Purchase discounts and allowances ++Sales returns and allowances Sales discounts Using gross method Using net method ++Normal shortages (breakage, shrinkage, etc.) Abnormal shortages ++Employee discounts Add Deduct Deduct - Deduct Deduct* Reduce sales Deduct - Deduct Deduct Deduct Deduct * Allowances Not included in retail component if they are not reflected as a reduction to the sales price. ++ NOT included in the ratio computation– only in arriving at ending retail inventory. Slide 9-18 UCSB, Anderson SPECIAL ITEMS ILLUSTRATION Special items solution Illustration Illustration9-22 9-22in inchapter chapter9. 9. Based Basedon onthe thebelow belowfacts, facts,compute computeConventional Conventionalretail retailinventory: inventory: Beginning inventory $1,000 Beginning inventory $1,000at atcost cost$1,800 $1,800at atretail; retail; Purchases at $30k and $60k at cost and retail, respectively; Purchases at $30k and $60k at cost and retail, respectively; Freight Freightin in$600; $600; Purchase Purchasereturns returnsof of$1,500 $1,500and and$3,000 $3,000at atcost costand andretail, retail, respectively; respectively; Markups $9,000; Markups $9,000; Abnormal Abnormalshortage shortage$1,200 $1,200and and$2,000 $2,000at atcost costand andretail, retail, respectively; respectively; Net Netmarkdowns markdowns$1,400 $1,400 Sales Sales$36,000 $36,000 Sales Salesreturns returns$900 $900 Employee Employeediscounts discounts$800 $800 Normal Normalshortage shortage$1,300 $1,300 Slide 9-19 UCSB, Anderson Beginning inventory Purchases Freight in Purchase returns Markups Abnormal shortage RATIO Inventory $ Sale Periodic Count -Replacement cost -NRV -NRV-Normal Profit $ Perpetual Middle value of above= “Designated Market Value” No-Count, but “cycle count” for controls Apply Method- see summary next slide Slide 9-20 GAAP INVENTORY! Slide 9-21 UCSB, Anderson Disclosure of Inventory Composition of manufactured inventory ....... (raw materials, WIP, and finished goods) Unusual or significant financing arrangement (related party transactions, firm purchase commitments, etc.) Inventory costing methods used. Consistency of costing methods from one period to another. 20 Slide 9-23 UCSB, Anderson Retail 1,800 60,000 (3,000) 9,000 (2,000) 65,800 (1,400) (35,100) (800) (1,300) 27,200 43.92% 11,947 Ratio Ending inventory UCSB, Anderson METHODS COVERED FIFO=LISH FIFO=LISH LIFO=FISH LIFO=FISH SPEC. SPEC.IDENTIFICATIONIDENTIFICATION-COMPUTER COMPUTER TRACKING TRACKING AVERAGE AVERAGE COST COST DOLLAR DOLLAR VALUE VALUE LIFO=D.S.M.A LIFO=D.S.M.A(Strips (Stripsout outeffects effectsof of increasing increasingcosts costs in inapplying applying LIFO) LIFO) RETAIL RETAIL METHODS METHODS(Relies (Relieson on Retail RetailTracking Tracking and and cost:retail cost:retailratio ratioto to“back “backinto” into”ending endinginventory) inventory) –– Conventional/ Conventional/LCM= LCM=M-Ups M-Upsonly only –– Cost/ Cost/Average AverageCost= Cost=M-ups M-upsand andM-downs, M-downs,less lessconservative conservative than than“conventional “conventionalretail retail –– LIFO LIFORetail= Retail=Use Useretail retailmethod methodbut butdetermine determineratios ratiosin in “Layers” “Layers”hence henceLIFO LIFOmethod. method.Uses UsesM-ups M-upsAND ANDM-downs M-downs Inventory at “Cost” Lower of “Cost” or “Market” (1,200) 28,900 43.92% Markdowns Sales, net of returns Employee discounts Normal shortage INVENTORY SUMMARY Company Cost 1,000 30,000 600 (1,500) Gross GrossProfit= Profit= NOT NOTGAAP, GAAP,but but sufficient sufficientfor forinternal internal management managementreporting. reporting. Slide 9-22 UCSB, Anderson


