Virtual WDS tutorial
advertisement

Virtual WDS tutorial
(TRAD)
Setting up:
From the Periodic Table select : 'Configuration', 'Instrumental Configuration'.
The configuration of the spectrometers can be set here and saved as the default.
For this tutorial, select the configuration shown below; then return to the periodic table
by clicking on the 'Done' button.
Example 1: A Superalloy
Click on 'TAP', and then 'Select elements'. The colour-coding indicates elements within the
spectrometer range. Choosing 'Help' and 'Selecting elements' will display the colour codes.
Click on Ta to define it as the analytical element. The colour-coding now shows possible
interfering elements (both 1st and higher orders).
Now click on Hf, W and Fe to indicate that these elements are also present (default concentrations
of 100% are assumed).
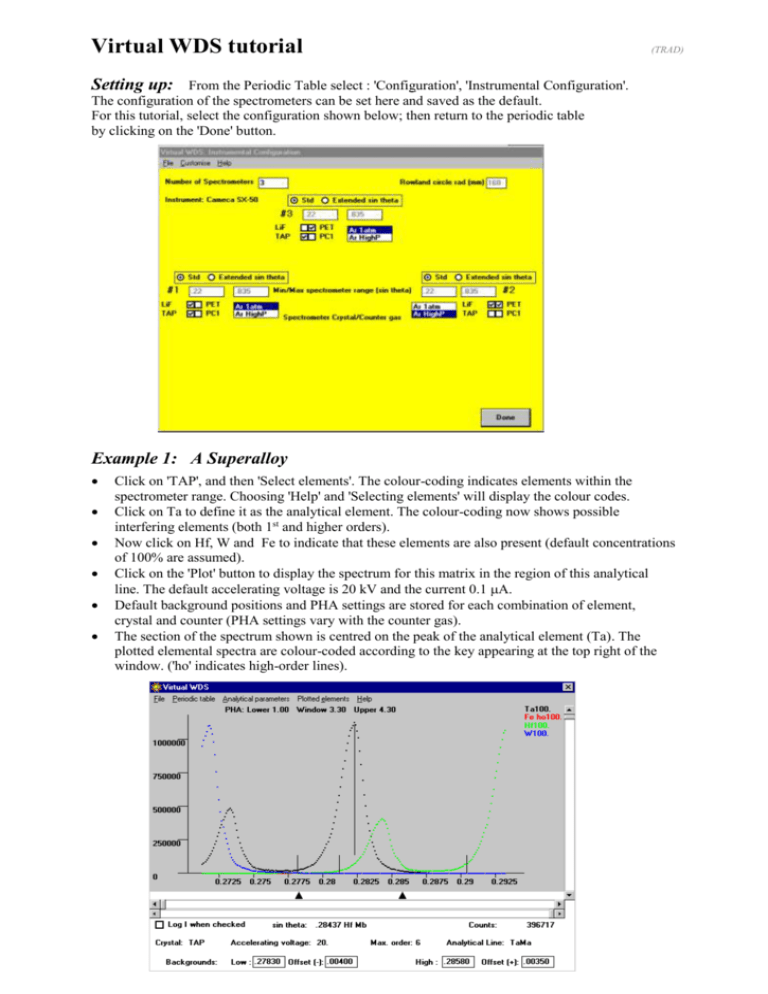
Click on the 'Plot' button to display the spectrum for this matrix in the region of this analytical
line. The default accelerating voltage is 20 kV and the current 0.1 A.
Default background positions and PHA settings are stored for each combination of element,
crystal and counter (PHA settings vary with the counter gas).
The section of the spectrum shown is centred on the peak of the analytical element (Ta). The
plotted elemental spectra are colour-coded according to the key appearing at the top right of the
window. ('ho' indicates high-order lines).
On placing the cursor on a peak, the peak identity will be shown below the centre of the spectrum.
If the cursor is moved along just below the x axis, the identity of any absorption edges (marked by
short vertical lines) will be shown instead.
The two triangular markers below the spectrum show the background positions (initially default
values). These can be moved by dragging and dropping (e.g. to avoid adjacent peaks).
Alternatively the values in the boxes below the spectrum may be overwritten, which will also
move the markers.
Semi-automatic background selection can be applied by choosing 'Analytical Parameters' and
'Background Optimisation'. The warning regarding concentrations is given because a sensible
estimate of continuum intensity cannot be made if the sum of the element concentrations is far
from 100%. To change to more realistic concentrations, choose 'Periodic Table' and 'Add matrix
element(s)', then overwrite the concentrations in the element boxes and press 'Plot'. (Other
elements may also be added.)
Two modes of background selection are offered, and clicking on the appropriate box will move
the markers to the computed locations. In the present case no low background position is
proposed, as the counts below Ta Ma are too high without going beyond the indicated Hf edge
(which will itself affect the background intensity). When a background marker is placed beyond
the range of the spectrum it is greyed out and is inoperative.
Choosing 'Analytical Parameters' and 'Update/Add element to Analysis Selection' will copy the
revised background values (and any other changes) to 'Analysis Selection'.
The plot shows that the Ta peak is affected by interference from Hf, indicating the necessity for a
correction to the experimental Ta data, which can be estimated approximately from the plot, but
for maximum accuracy should be determined experimentally with your own instrument.
It may be appropriate to consider using an alternative crystal. To change crystal, select 'Periodic
Table', 'Add matrix element(s)' and 'Analysis Conditions', then click on PET, press 'Select
Elements' button, click on Ta to reselect the analytical element, and press the 'Plot' button. The Ta
and Hf peaks are now resolved almost completely, but their intensity is lower.
Example 2: Trace element in known matrix - Sr in YBCO superconductor.
Choosing 'Periodic Table' and 'New matrix and Analysis Selection' will reset the program for a new
case. In the following example, the concentration of a trace element in a known matrix is required. To
obtain a realistic estimate of count times required for a given detection limit or precision, a reasonable
approximation of the matrix composition is necessary. Element weight percentages can be entered
directly in the element boxes in the periodic table, or for a stoichiometric compound a formula can be
entered as follows:
Choose 'Concentrations' and 'Enter as formula', and enter 'YBa2Cu3O7'. The concentrations will
appear in the boxes in the periodic table.
Place the cursor on the Periodic Table in the green box below Sr and enter 0.1 as the assumed
concentration (in weight percent) for this element.
Return to 'Analysis Conditions'. Clicking on Sr will generate a table showing X-ray lines and
crystals available for this element, for the given accelerating voltage (20 kV by default). Also
shown are the overvoltage ratio U (accelerating voltage/x-ray excitation voltage), full width at half
maximum of the line, peak intensity (counts/sec/microamp). The peak:background ratio is affected
by the continuum count-rate, and thus is only meaningful if a fair approximation to the true
composition has been entered on the periodic table.
For trace elements it is best to choose a line/crystal combination which offers the highest value of
count-rate multiplied by peak:background ratio. If required, the crystal can be changed in the light
of this information.
Press the 'Select Elements' button and click on Sr to select this as the analytical element, then press
the 'Plot' button.
The peak intensities are scaled according to the concentrations. In this case there are no serious
interferences and the default background positions are satisfactory.
Selecting 'Analytical parameters' and 'Counting strategy' allows the count times to be adjusted
intelligently. For example, select 'Calculate required time for specified detection limit', enter
0.01% in the box below, and click on the 'Calculate' button. This will display count times
recommended for peak and background in order to achieve this detection limit. (Note that a
realistic matrix composition is required; also the result is dependent on the beam voltage and
current). Alternatively the user may specify the total count time and use the 'Calculate' button to
determine the precision, with the background count times partitioned in proportion to the countrates at these positions.
When a suitable set of count times are displayed, click on the spectrum plot and choose 'Analytical
Parameters' and 'Update/Add element to Analysis Selection'.
The list of elements shown in the plot window (top right) indicates that the Cu and Ba
interferences are high-order lines. By selecting 'Analytical parameters' and 'Overlaps and
continuum' it can be shown that these are 5th and 3rd order lines respectively.
A small Ba peak is just visible above the baseline of the plot; dragging the slider on the right of
the plot to the bottom will adjust the intensity scale such that other low intensity Ba lines (also 3rd
order) are revealed. (The logarithmic plot facility can also be used for this purpose.) The sliders
below the spectrum can be used in the same way to zoom in on a particular part of the spectrum.
The high-order line intensities are affected by the PHA settings (shown at the top of the displayed
spectrum), which are applied automatically. Choosing 'Analytical Parameters' and 'PHA control'
will show a simulated pulse height distribution. To the right of this plot is a list of the high orders
present, with their colours. The % values refer to the proportion of their pulse height distributions
falling within the PHA window. In this case the plot shows the pulse height distribution for 1st
order line and just the escape peak of the 3rd order lines (the whole of the 5th order distribution
falls beyond the maximum of the pulse height scale).
The lower level and window settings of the PHA can be adjusted by either changing the values in
the text boxes or dragging and dropping the markers. If the rightmost marker is moved beyond the
end of the x scale then it will be greyed out and the window value in the text box cleared,
indicating that only the lower level is in use. The % figures to the right of the plot indicate that all
orders of reflection will now be counted. To apply the new values, click on the 'Update plot'
button.
The intensity of the 3rd order Ba line is now much greater and even the 5th order Cu line is visible
above the baseline. Clearly it is desirable to use the PHA window for low-level analysis of Sr in
this matrix. In cases where revised PHA settings are wanted for analysis, the Analysis Selection
can be amended as before by choosing 'Analytical Parameters' and 'Update/Add element to
Analysis Selection'.


