Radioactivity: process in which the nucleus of a radioactive atom
advertisement
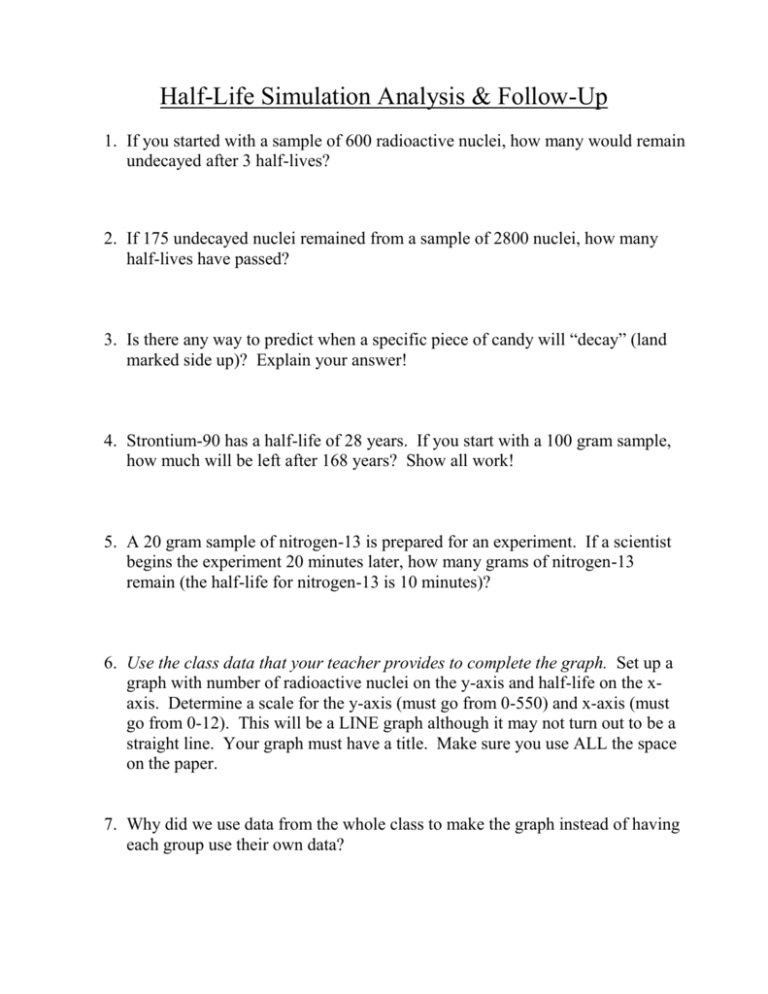
Half-Life Simulation Analysis & Follow-Up 1. If you started with a sample of 600 radioactive nuclei, how many would remain undecayed after 3 half-lives? 2. If 175 undecayed nuclei remained from a sample of 2800 nuclei, how many half-lives have passed? 3. Is there any way to predict when a specific piece of candy will “decay” (land marked side up)? Explain your answer! 4. Strontium-90 has a half-life of 28 years. If you start with a 100 gram sample, how much will be left after 168 years? Show all work! 5. A 20 gram sample of nitrogen-13 is prepared for an experiment. If a scientist begins the experiment 20 minutes later, how many grams of nitrogen-13 remain (the half-life for nitrogen-13 is 10 minutes)? 6. Use the class data that your teacher provides to complete the graph. Set up a graph with number of radioactive nuclei on the y-axis and half-life on the xaxis. Determine a scale for the y-axis (must go from 0-550) and x-axis (must go from 0-12). This will be a LINE graph although it may not turn out to be a straight line. Your graph must have a title. Make sure you use ALL the space on the paper. 7. Why did we use data from the whole class to make the graph instead of having each group use their own data?
