Manuscript for submission to Thorax
advertisement
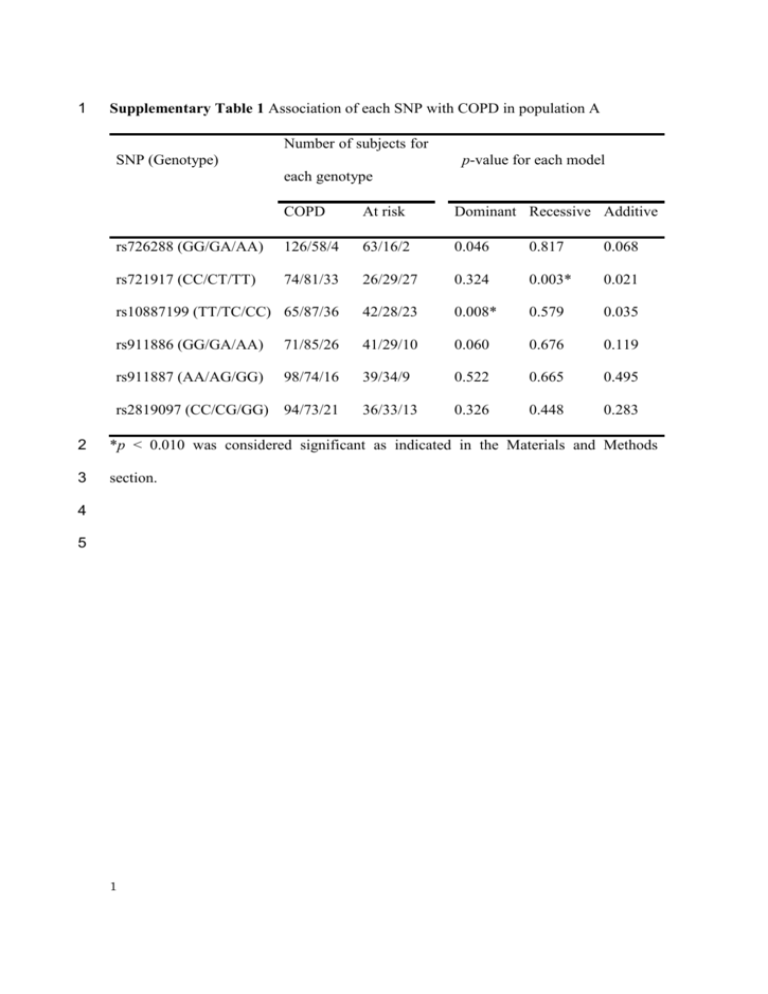
1 Supplementary Table 1 Association of each SNP with COPD in population A Number of subjects for SNP (Genotype) p-value for each model each genotype COPD At risk Dominant Recessive Additive rs726288 (GG/GA/AA) 126/58/4 63/16/2 0.046 0.817 0.068 rs721917 (CC/CT/TT) 74/81/33 26/29/27 0.324 0.003* 0.021 rs10887199 (TT/TC/CC) 65/87/36 42/28/23 0.008* 0.579 0.035 rs911886 (GG/GA/AA) 71/85/26 41/29/10 0.060 0.676 0.119 rs911887 (AA/AG/GG) 98/74/16 39/34/9 0.522 0.665 0.495 36/33/13 0.326 0.448 0.283 rs2819097 (CC/CG/GG) 94/73/21 2 *p < 0.010 was considered significant as indicated in the Materials and Methods 3 section. 4 5 1 1 Supplementary Table 2 Hardy–Weinberg equilibrium of SFTPD gene polymorphisms p-values for testing Hardy–Weinberg equilibrium Population A Population B Subjects Subjects with SNP COPD At risk without emphysema emphysema rs726288 0.366 0.432 rs721917 0.191 0.008 0.389 0.075 rs10887199 0.477 0.055 0.437 0.418 rs911886 0.945 0.189 rs911887 0.703 0.700 rs2819097 0.241 0.252 2 3 2 1 Supplementary Table 3 Correlation matrix of the SNPs of SFTPD rs726288 2 rs721917 rs10887199 rs911886 rs911887 rs2819097 rs726288 1 0.374082 0.543016 0.576018 0.281266 0.211094 rs721917 0.374082 1 0.671683 0.59088 0.095351 0.506886 rs10887199 0.543016 0.671683 1 0.890226 0.515039 0.27486 rs911886 0.576018 0.59088 0.890226 1 0.478583 0.291363 rs911887 0.281266 0.095351 0.515039 0.478583 1 0.357006 rs2819097 0.211094 0.506886 0.27486 0.291363 0.357006 1 Note: Pairwise correlations are given in italics. 3 4 3 1 Supplementary Table 4 Correlation matrix of the phenotypes FEV1% phenotypes %DLCO/VA LAA% LAA%-U WA% 1 0.3886 -0.5596 -0.4522 -0.2957 %DLCO/VA 0.3886 1 -0.683 -0.6853 0.08 LAA% -0.5596 -0.683 1 0.9289 -0.0249 LAA%-U -0.4522 -0.6853 0.9289 1 -0.0079 WA% -0.2957 0.08 -0.0249 -0.0079 1 predicted. FEV1% predicted 2 Note: Pairwise correlations are given in italics. 3 4 4 1 Supplementary Table 5 Association of each SNP with emphysema in population B Number of subjects for each SNP (Genotype) p-value for each model genotype Emphysema Not emphysema Dominant Recessive Additive rs721917 (CC/CT/TT) 66/77/17 309/505/157 0.474 0.280 0.177 rs10887199 (TT/TC/CC) 48/75/37 332/482/157 0.280 0.474 0.085 2 3 5 1 Supplementary Table 6 The association between the SNPs of SFTPD and the serum 2 concentration or the phenotypes of COPD in population A. 3 p-values on correlation Serum concentration of SNPs SFTPD (log transformed) rs726288 1.1 × 10⁻⁶* rs721917 7.0 × 10⁻¹¹* rs10887199 5.0 × 10⁻¹²* rs911886 7.1 × 10⁻⁹* rs911887 0.19 rs2819097 0.0024* 4 *p < 0.010 was considered significant as indicated in the Materials and Methods 5 section. 6 6
