Improving Service Times at Dave`s Burgers
advertisement
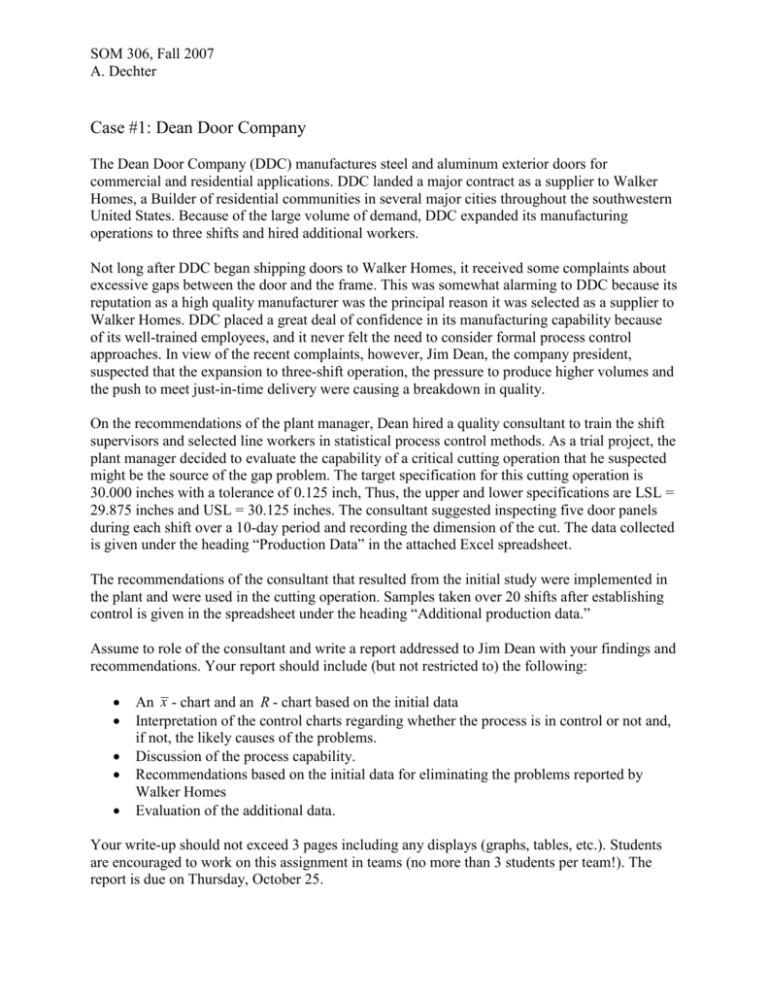
SOM 306, Fall 2007 A. Dechter Case #1: Dean Door Company The Dean Door Company (DDC) manufactures steel and aluminum exterior doors for commercial and residential applications. DDC landed a major contract as a supplier to Walker Homes, a Builder of residential communities in several major cities throughout the southwestern United States. Because of the large volume of demand, DDC expanded its manufacturing operations to three shifts and hired additional workers. Not long after DDC began shipping doors to Walker Homes, it received some complaints about excessive gaps between the door and the frame. This was somewhat alarming to DDC because its reputation as a high quality manufacturer was the principal reason it was selected as a supplier to Walker Homes. DDC placed a great deal of confidence in its manufacturing capability because of its well-trained employees, and it never felt the need to consider formal process control approaches. In view of the recent complaints, however, Jim Dean, the company president, suspected that the expansion to three-shift operation, the pressure to produce higher volumes and the push to meet just-in-time delivery were causing a breakdown in quality. On the recommendations of the plant manager, Dean hired a quality consultant to train the shift supervisors and selected line workers in statistical process control methods. As a trial project, the plant manager decided to evaluate the capability of a critical cutting operation that he suspected might be the source of the gap problem. The target specification for this cutting operation is 30.000 inches with a tolerance of 0.125 inch, Thus, the upper and lower specifications are LSL = 29.875 inches and USL = 30.125 inches. The consultant suggested inspecting five door panels during each shift over a 10-day period and recording the dimension of the cut. The data collected is given under the heading “Production Data” in the attached Excel spreadsheet. The recommendations of the consultant that resulted from the initial study were implemented in the plant and were used in the cutting operation. Samples taken over 20 shifts after establishing control is given in the spreadsheet under the heading “Additional production data.” Assume to role of the consultant and write a report addressed to Jim Dean with your findings and recommendations. Your report should include (but not restricted to) the following: An x - chart and an R - chart based on the initial data Interpretation of the control charts regarding whether the process is in control or not and, if not, the likely causes of the problems. Discussion of the process capability. Recommendations based on the initial data for eliminating the problems reported by Walker Homes Evaluation of the additional data. Your write-up should not exceed 3 pages including any displays (graphs, tables, etc.). Students are encouraged to work on this assignment in teams (no more than 3 students per team!). The report is due on Thursday, October 25.
