P(A) =
advertisement
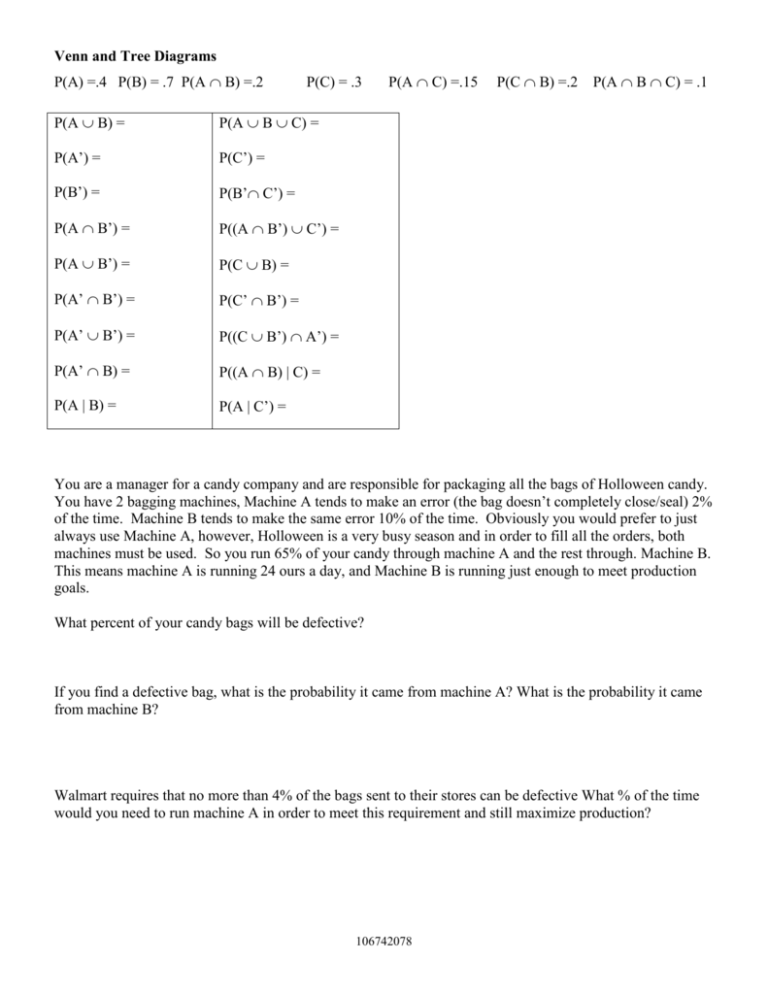
Venn and Tree Diagrams P(A) =.4 P(B) = .7 P(A B) =.2 P(C) = .3 P(A B) = P(A B C) = P(A’) = P(C’) = P(B’) = P(B’ C’) = P(A B’) = P((A B’) C’) = P(A B’) = P(C B) = P(A’ B’) = P(C’ B’) = P(A’ B’) = P((C B’) A’) = P(A’ B) = P((A B) | C) = P(A | B) = P(A | C’) = P(A C) =.15 P(C B) =.2 P(A B C) = .1 You are a manager for a candy company and are responsible for packaging all the bags of Holloween candy. You have 2 bagging machines, Machine A tends to make an error (the bag doesn’t completely close/seal) 2% of the time. Machine B tends to make the same error 10% of the time. Obviously you would prefer to just always use Machine A, however, Holloween is a very busy season and in order to fill all the orders, both machines must be used. So you run 65% of your candy through machine A and the rest through. Machine B. This means machine A is running 24 ours a day, and Machine B is running just enough to meet production goals. What percent of your candy bags will be defective? If you find a defective bag, what is the probability it came from machine A? What is the probability it came from machine B? Walmart requires that no more than 4% of the bags sent to their stores can be defective What % of the time would you need to run machine A in order to meet this requirement and still maximize production? 106742078
