Supplementary Tables 1–3 (doc 114K)
advertisement
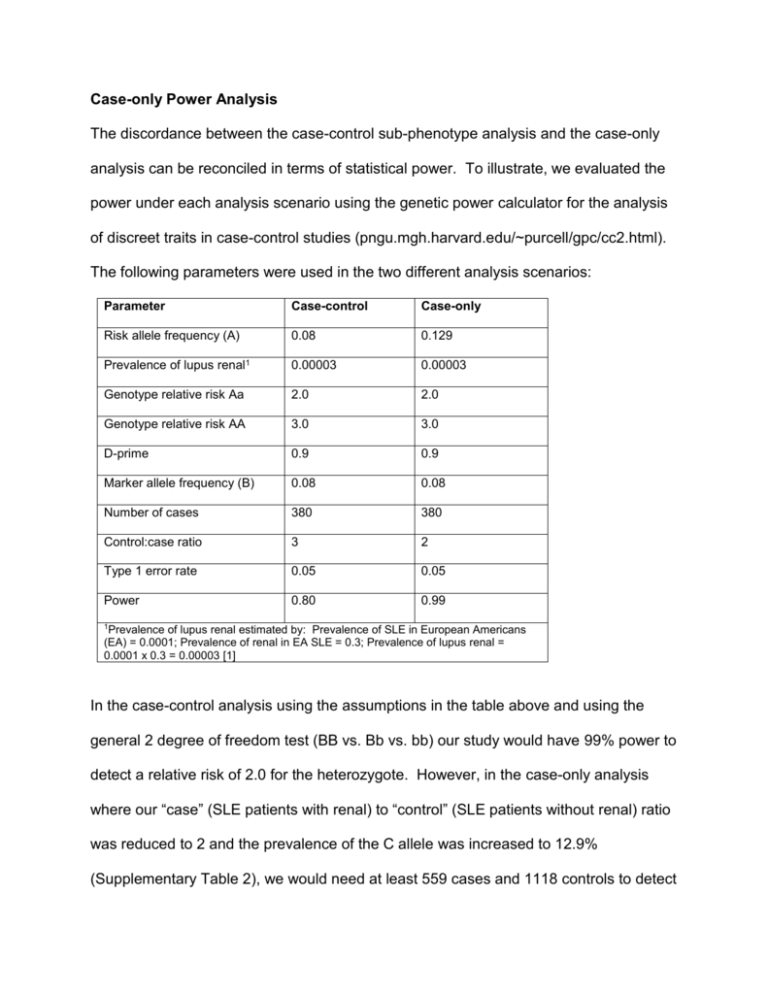
Case-only Power Analysis The discordance between the case-control sub-phenotype analysis and the case-only analysis can be reconciled in terms of statistical power. To illustrate, we evaluated the power under each analysis scenario using the genetic power calculator for the analysis of discreet traits in case-control studies (pngu.mgh.harvard.edu/~purcell/gpc/cc2.html). The following parameters were used in the two different analysis scenarios: Parameter Case-control Case-only Risk allele frequency (A) 0.08 0.129 Prevalence of lupus renal1 0.00003 0.00003 Genotype relative risk Aa 2.0 2.0 Genotype relative risk AA 3.0 3.0 D-prime 0.9 0.9 Marker allele frequency (B) 0.08 0.08 Number of cases 380 380 Control:case ratio 3 2 Type 1 error rate 0.05 0.05 Power 0.80 0.99 1Prevalence of lupus renal estimated by: Prevalence of SLE in European Americans (EA) = 0.0001; Prevalence of renal in EA SLE = 0.3; Prevalence of lupus renal = 0.0001 x 0.3 = 0.00003 [1] In the case-control analysis using the assumptions in the table above and using the general 2 degree of freedom test (BB vs. Bb vs. bb) our study would have 99% power to detect a relative risk of 2.0 for the heterozygote. However, in the case-only analysis where our “case” (SLE patients with renal) to “control” (SLE patients without renal) ratio was reduced to 2 and the prevalence of the C allele was increased to 12.9% (Supplementary Table 2), we would need at least 559 cases and 1118 controls to detect to detect an effect with OR 2.0 at 99% power. This suggests that our inability to replicate a significant effect for SLE sub-phenotypes in the case-only analysis was likely due to reduced statistical power resulting from a decreased sample size. Note that these calculations were done using the details of the renal subset as it had the smallest sample size, but certainly, given the slightly smaller effect size but slightly larger sample, these results can be generalized to the analyses of hematologic traits as well. Supplementary Table 1. Imputation results of SLE associated SNPs reported in other studies. SNP Study BP NPRX INFO A1 A2 F_A F_U CHISQ P OR rs2327832 rs6920220 rs13192841 rs12527282 rs10499194 rs6922466 [2] [3-5] [2] [2] [3] [2] 138014761 138048197 138008907 138008945 138044330 138486623 5 4 5 5 5 5 0.999 0.985 0.981 0.981 0.982 0.986 C A A T T G A G G C C A 0.2459 0.2494 0.2629 0.2629 0.2651 0.2278 0.2135 0.2144 0.2765 0.2765 0.2768 0.2348 4.433 5.134 0.6639 0.6639 0.4902 0.1941 0.03525 0.02346 0.4152 0.4152 0.4838 0.6595 1.202 1.218 0.933 0.933 0.942 0.961 Observed SNPs are shown in italicized font BP = base pair position on chromosome 6, build 36 NPRX - number of proxy SNPs used to impute INFO - score of accuracy of imputation A1/A2 - allele 1 or 2 F_A/F_U - allele frequency in affected/unaffected Supplementary Table 2. Conditional analysis of clinical traits (Case:Case Analysis) SLE Cases Conditioned on: CG GG Positive:Negative Positive:Negative OR 95% C.I. P-value 49:40 330:416 1.54 0.99-2.40 0.0543 88:56 661:537 1.28 0.90-1.82 0.17 33:111 209:989 1.41 0.93-2.13 0.11 a Renal b Hematology c Renal or Hematology a SLE Cases positive or negative for renal SLE Cases positive or negative for hematologic manifestations c SLE Cases positive or negative for either renal or hematologic manifestations b . Supplementary Table 3. Grouping of each SLE criteria into clusters R2 within group R2 within next closest group Malar Rash 0.55 0.004 Photosensitivity 0.45 0.03 Oral Ulcers 0.43 0.01 Renal 0.33 0.02 Hematologic 0.46 0.03 Immunologic 0.52 0.003 Arthritis 0.57 0.01 Serositis 0.57 0.01 4 Neurologic 1.00 0.004 5 Discoid rash 1.00 0.01 Cluster 1 2 Sub-Phenotype 3 Supplemental References 1. Wallace, D.J., The Clinical Presentation of Systemic Lupus Erythematosus, in Dubois' Lupus Erythematosus, D.J. Wallace and B.H. Hahn, Editors. 2007, Lippincott Williams & Wilkins: Philadelphia. p. 638-646. 2. Musone, S.L., et al., Multiple polymorphisms in the TNFAIP3 region are independently associated with systemic lupus erythematosus. Nat Genet, 2008. 3. Plenge, R.M., et al., Two independent alleles at 6q23 associated with risk of rheumatoid arthritis. Nat Genet, 2007. 39(12): p. 1477-82. 4. Thomson, W., et al., Rheumatoid arthritis association at 6q23. Nat Genet, 2007. 39(12): p. 1431-3. 5. Genome-wide association study of 14,000 cases of seven common diseases and 3,000 shared controls. Nature, 2007. 447(7145): p. 661-78.

