Homework Set #6
advertisement

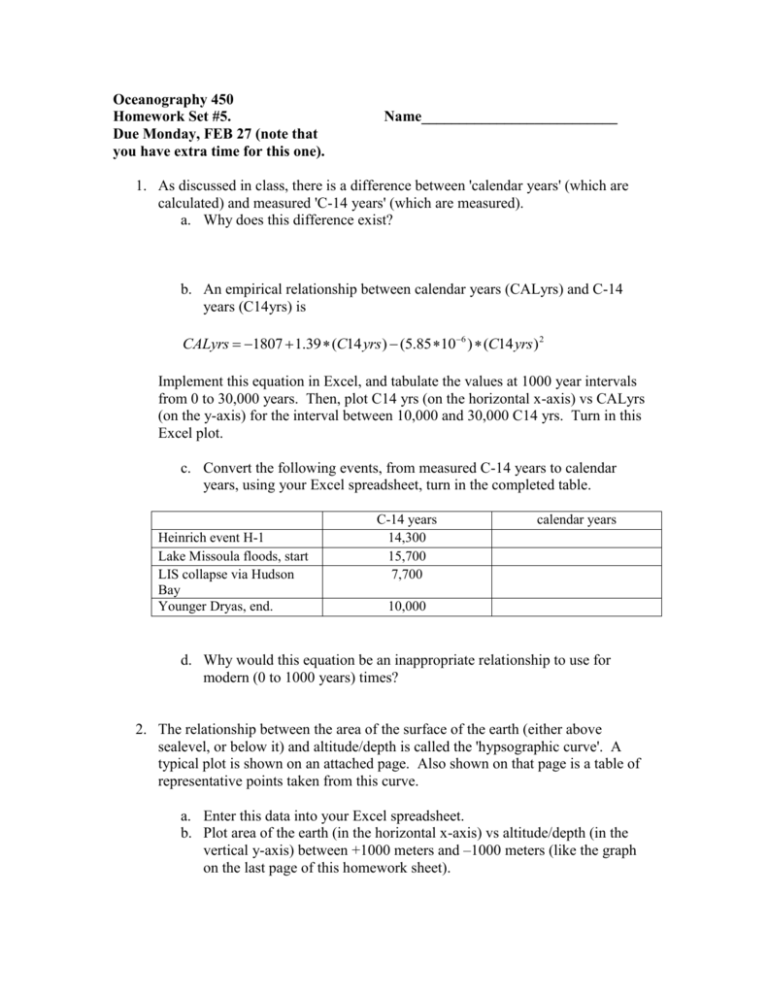
Oceanography 450 Homework Set #5. Due Monday, FEB 27 (note that you have extra time for this one). Name__________________________ 1. As discussed in class, there is a difference between 'calendar years' (which are calculated) and measured 'C-14 years' (which are measured). a. Why does this difference exist? b. An empirical relationship between calendar years (CALyrs) and C-14 years (C14yrs) is CALyrs 1807 1.39 (C14 yrs ) (5.85 106 ) (C14 yrs ) 2 Implement this equation in Excel, and tabulate the values at 1000 year intervals from 0 to 30,000 years. Then, plot C14 yrs (on the horizontal x-axis) vs CALyrs (on the y-axis) for the interval between 10,000 and 30,000 C14 yrs. Turn in this Excel plot. c. Convert the following events, from measured C-14 years to calendar years, using your Excel spreadsheet, turn in the completed table. Heinrich event H-1 Lake Missoula floods, start LIS collapse via Hudson Bay Younger Dryas, end. C-14 years 14,300 15,700 7,700 calendar years 10,000 d. Why would this equation be an inappropriate relationship to use for modern (0 to 1000 years) times? 2. The relationship between the area of the surface of the earth (either above sealevel, or below it) and altitude/depth is called the 'hypsographic curve'. A typical plot is shown on an attached page. Also shown on that page is a table of representative points taken from this curve. a. Enter this data into your Excel spreadsheet. b. Plot area of the earth (in the horizontal x-axis) vs altitude/depth (in the vertical y-axis) between +1000 meters and –1000 meters (like the graph on the last page of this homework sheet). c. Fit a 4th order polynomial curve (i.e., trendline) through this data and give the equation below. This will give you the functional relationship of DEPTH = as a function of (AREA). Turn in this plot with the trendline shown. HINT: if you haven’t done curve fitting before, search the Excel HELP for the word ‘trendline’. d. Now, invert the data, so you have an equation that gives AREA = as a function of (DEPTH). The easiest way to do this is to break the data up into two sections: (i) ABOVE sea level and (ii) BELOW sea level and treat them separately. Then plot DEPTH/ALTITUDE on the x-axis (horizontal) and AREA on the y-axis (vertical). You will need to make two plots, one 0 to +1000 meters (altitude), and the other -1000 meters to 0 (depth below sea level). Fit a 4th order polynomial equation through each of these, and write these equations below. i. Above Sea level ____________________________________________________________ ii. Below Sea level_____________________________________________________________ e. Finally, assume that all the ice in the Greenland Ice Cap (2.6 x 10⁶ km3) and Antarctic Ice Cap (3.01 x 10⁷ km3) melts. Ignore temperature changes in the water and the fact that some of these ice caps are below sea level or floating. Use the standard 'Rule of Thumb' that 1 km3 of ice melt raises sea level by 0.24 x 10⁻² millimeters. Calculate the area of the earth that would be flooded by this melting. Total area of the earth is approximately 5.1 x 10⁸ km2 and total area of the ocean is 362 x 106 km2. HINT: just use the 0 to +1000 meter plot in section d above. Calculate the total volume of new melt water, calculate the new elevation of sealevel (use Excel or your calculator, if you need to), then use your trendline fit (4th order polynomial) equation from the plot in part d(i) above. Write your answers below (show your work on another piece of paper) Sea level change for Greenland and Antarctic melt _________________________________ Area of newly flooded regions ______________________________________ Percentage of earth’s surface that would be newly flooded. __________________________ depth or altitude above or below sealevel in meters 1000 850 750 600 500 400 300 200 150 100 50 0 -75 -100 -150 -200 -300 -400 -500 -600 -750 -850 -1000 area of earth in units of 108 km2 0.56 0.6 0.65 0.7 0.76 0.8 0.85 0.92 1 1.12 1.25 1.43 1.59 1.64 1.69 1.75 1.81 1.85 1.88 1.9 1.93 1.94 1.95 Hypsographic curve of the earth; total area is approximately 5.1 x 10⁸ km3


