7.7 Population Ecology Part 1
advertisement
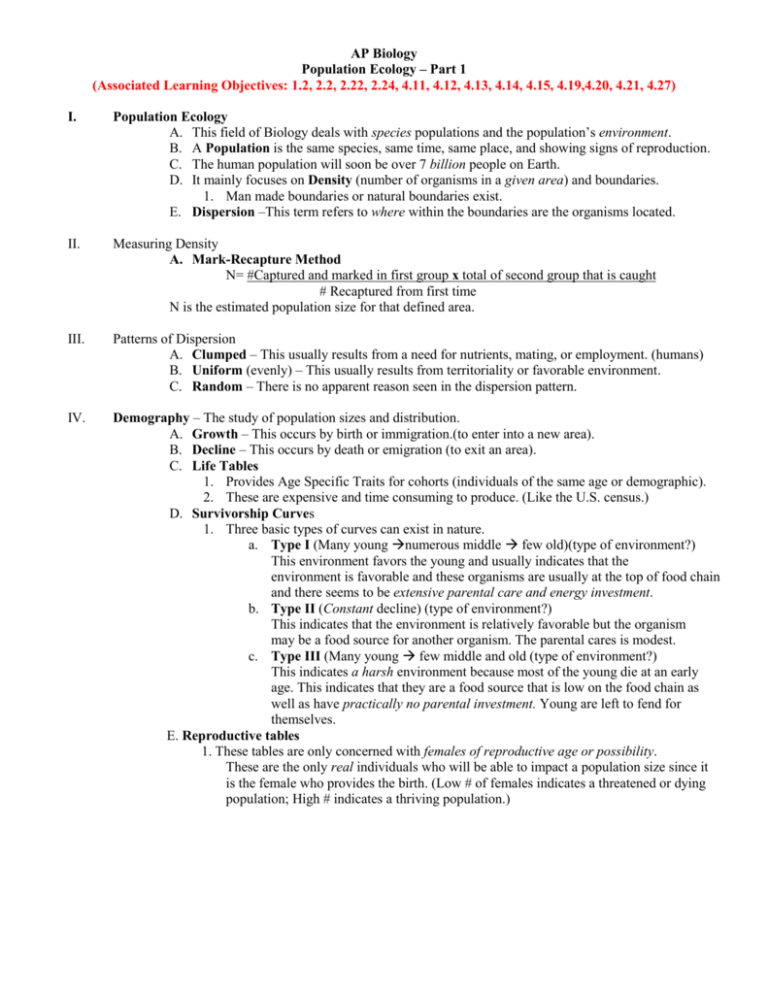
AP Biology Population Ecology – Part 1 (Associated Learning Objectives: 1.2, 2.2, 2.22, 2.24, 4.11, 4.12, 4.13, 4.14, 4.15, 4.19,4.20, 4.21, 4.27) I. Population Ecology A. This field of Biology deals with species populations and the population’s environment. B. A Population is the same species, same time, same place, and showing signs of reproduction. C. The human population will soon be over 7 billion people on Earth. D. It mainly focuses on Density (number of organisms in a given area) and boundaries. 1. Man made boundaries or natural boundaries exist. E. Dispersion –This term refers to where within the boundaries are the organisms located. II. Measuring Density A. Mark-Recapture Method N= #Captured and marked in first group x total of second group that is caught # Recaptured from first time N is the estimated population size for that defined area. III. Patterns of Dispersion A. Clumped – This usually results from a need for nutrients, mating, or employment. (humans) B. Uniform (evenly) – This usually results from territoriality or favorable environment. C. Random – There is no apparent reason seen in the dispersion pattern. IV. Demography – The study of population sizes and distribution. A. Growth – This occurs by birth or immigration.(to enter into a new area). B. Decline – This occurs by death or emigration (to exit an area). C. Life Tables 1. Provides Age Specific Traits for cohorts (individuals of the same age or demographic). 2. These are expensive and time consuming to produce. (Like the U.S. census.) D. Survivorship Curves 1. Three basic types of curves can exist in nature. a. Type I (Many young numerous middle few old)(type of environment?) This environment favors the young and usually indicates that the environment is favorable and these organisms are usually at the top of food chain and there seems to be extensive parental care and energy investment. b. Type II (Constant decline) (type of environment?) This indicates that the environment is relatively favorable but the organism may be a food source for another organism. The parental cares is modest. c. Type III (Many young few middle and old (type of environment?) This indicates a harsh environment because most of the young die at an early age. This indicates that they are a food source that is low on the food chain as well as have practically no parental investment. Young are left to fend for themselves. E. Reproductive tables 1. These tables are only concerned with females of reproductive age or possibility. These are the only real individuals who will be able to impact a population size since it is the female who provides the birth. (Low # of females indicates a threatened or dying population; High # indicates a thriving population.)

